
Communication Equipment
Sterlite Technologies Limited (STLTECH) moves down 5% intraday
Sterlite Technologies Limited (STLTECH) experiences a 5% intraday decline to ₹555.9, signaling a breakdown in its trendline status.

Sterlite Technologies Limited (STLTECH) fell -5% today, marking a shift in trendline status from BREAKOUT to CONSOLIDATING UP. This move comes as the stock is 27.5% above its resistance level of ₹403, indicating a stretched position. STLTECH operates in the technology sector, specifically communication equipment, and today’s move appears to be more company-specific rather than a sector-wide trend.
Technical setup — trendlines & DMA
The current 6M trendline structure shows a breakdown, with the stock now trading below its 6M support trendline end of ₹640.88 by 15.29%. Resistance is at ₹403.26, a level the stock has broken above by 27.46%. The 50-DMA stands at ₹498.8, indicating the stock is 17.30% above this average, suggesting an extended move. In the 52W range of ₹84.6–₹679.9, the stock is in the upper third, reflecting a significant upward move from the 52W low but still -18.2% from the 52W high, indicating some room for further upside.
Snapshot: ₹555.90 on 2026-07-07 (chart frozen at publication)
Fundamentals & business context
With a PE of 508.8 and a profit margin of 1.2%, STLTECH’s valuation appears stretched relative to its current earnings, especially given the revenue CAGR of -11.3%. The market may be pricing in a potential turnaround, but the current business performance does not support such a high valuation. Institutional ownership at 12.1% suggests a cautious approach by the smart money, possibly reflecting concerns over the company’s growth trajectory and profitability. There is no NSE catalyst today, indicating the move is technical in nature.
Algorithmic scorecard
The overall scorecard reflects a technically strong but fundamentally weak position. The strongest signals include the bullish trend, with the 50-day average above the 200-day average, and the stock’s significant gain of 417.2% in the last year, indicating strong momentum. However, the weakest signals are the declining revenue and profit CAGRs, and the low profit margin of 1.2%, which leave the company vulnerable to further declines in profitability and revenue. Additionally, the negligible dividend yield of 0% offers little income for investors, further highlighting the risks associated with this stock.
Company outlook
Management provided a positive outlook, expecting a positive impact on margins from the reduction in U.S. tariffs, though this is offset by increased costs due to geopolitical issues. They aim to achieve a 20% EBITDA margin by the end of Q4. The company is focusing on long-term contracts rather than spot market sales to mitigate cyclical risks and is in ongoing discussions with hyperscalers for long-term partnerships. Capex of approximately INR 500 crores is planned to upgrade the asset base and support high-value data center portfolio offerings. The focus remains on securing long-term contracts and relationships with telecom operators and data centers.
Get all details on STLTECH — P&L, peers, shareholding and more on TradeAlone.







Communication Equipment
Pace Digitek Limited (pacedigitk) Secures its Largest-ever BESS Order Worth Rs. 2,691 Crore from NTPC Green Energy
Pace Digitek Limited secures a landmark Rs. 2,691 crore BESS order from NTPC Green Energy, marking its largest order to date.

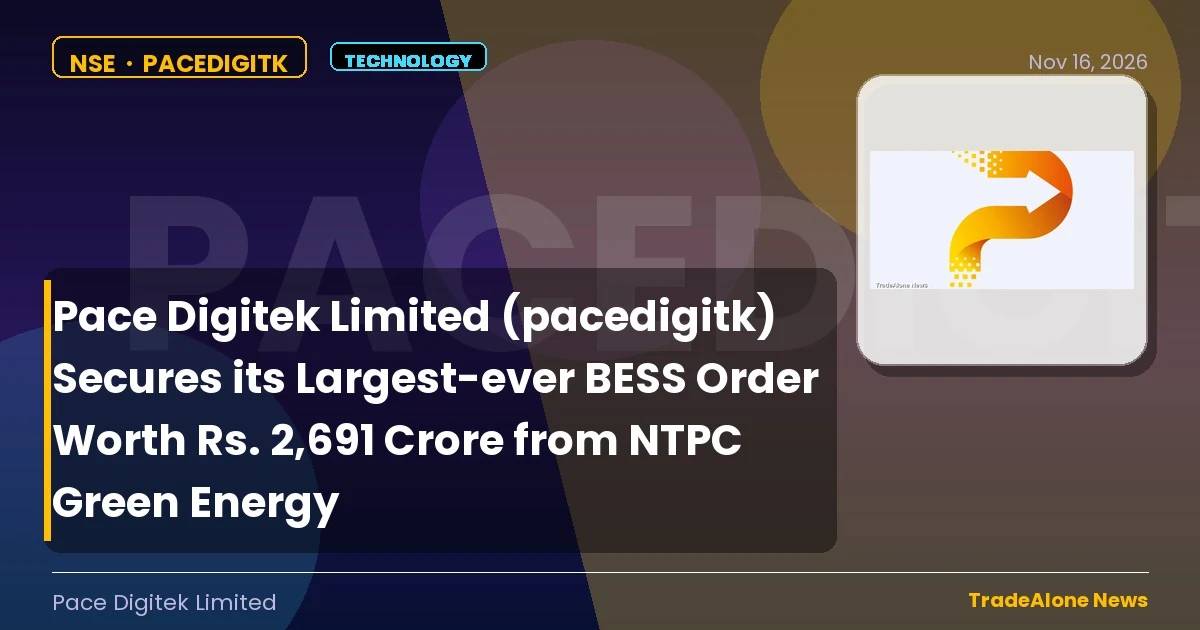
Pace Digitek Limited (NSE: PACEDIGITK) has secured its largest-ever Battery Energy Storage System (BESS) order worth Rs. 2,691 crore from NTPC Green Energy Limited. This significant win marks a major milestone for the company, showcasing its capabilities in engineering, procurement, construction (EPC), and long-term operational maintenance of BESS systems.
Key Details of the Order
The order includes the engineering, procurement, construction, and long-term maintenance of a 600 MW / 1800 MWh BESS for the Khavda Solar Project in Gujarat. This project is part of NTPC Green Energy’s flagship 3300 MWh BESS project, comprising Block-01 (300 MW / 900 MWh) and Block-02 (300 MW / 900 MWh) under Cluster-01. The scope of work includes BESS system supply, system integration, installation, testing, commissioning, civil works, and 15-year operations & maintenance.
Impact on Company’s Order Book
Following this landmark order win, Pace Digitek’s cumulative order inflows for FY2027 have reached Rs. 5,129 crore, elevating its total executable order book to Rs. 13,427 crore. This significant order is supported by the company’s consolidated BESS project portfolio of 6.62 GWh across EPC and BOO/BOOT models.
Chairman’s Statement
Commenting on the development, Mr. Venugopal Rao Maddisetty, Chairman & Managing Director of Pace Digitek Limited, said: “Winning this landmark BESS order is a validation of Pace Digitek’s manufacturing scale, engineering depth, and project execution capabilities. As a Class-I Local Supplier under domestic value addition guidelines, this award highlights the crucial role of local content and domestic manufacturing in advancing India’s energy storage goals. With 5 GWh of operational domestic BESS manufacturing capacity and our expansion towards 10 GWh progressing, we have built the manufacturing infrastructure to support growing market requirements. Our experience in supplying BESS systems and executing utility-scale storage projects provides a strong foundation for delivering this project. We remain focused on translating the growing demand for energy storage into sustainable business growth through manufacturing scale, execution discipline, and a balanced portfolio of supply, EPC, and long-term projects.”
Source: NSE Corporate Announcement
Fundamental & Technical Analysis of Pace Digitek Limited
Pace Digitek Limited belongs to the Technology › Communication Equipment sector. Here’s a quick read on where the business and the stock stand today.
Pace moves sideways over three months, with neither buyers nor sellers taking control. The PEG of 0.06 is extremely low. Either the market misses the growth story, or there is a catch worth investigating. Revenue grows at 73.9% and profits at 175.1% CAGR. Both numbers are exceptional. The stock gains 4.9% in the last month, recovering from the three-month slide. However, it is too early to call this a confirmed reversal. Revenue grows at 73.9% and profits at 175.1%. The business is in good shape. Moreover, a stock that does not move despite strong fundamentals often offers better value than one already priced for perfection. Check Fundamentals of Pace Digitek Limited.
Communication Equipment
Tamilnadu Telecommunication Limited (tntele) Reports Q2 FY27: Net Loss Deepens
Tamilnadu Telecommunication Limited (TNTELE) reports a deepening net loss in Q2 FY27, reflecting challenges in the telecom sector.

Tamilnadu Telecommunication Limited (TNTELE) announced its unaudited financial results for the quarter ended 30th September 2026. The company, a joint venture of TCIL, Govt. of India enterprise, and TIDCO, Govt. of Tamil Nadu enterprise, reported a net loss of ₹449.23 crores for the quarter, compared to a loss of ₹341.34 crores in the same quarter last year. This deepening loss reflects ongoing challenges in the telecom sector.
Financial Performance
The total income from operations stood at ₹250 crores for the quarter, significantly lower than the ₹250 crores reported in the previous quarter and ₹376 crores for the same period last year. The net profit/loss for the period before tax was a loss of ₹449.23 crores, compared to a loss of ₹341.34 crores in the previous quarter and ₹429.82 crores in the same quarter last year.
Earnings Per Share
The earnings per share (EPS) for the quarter were negative, with basic and diluted EPS both at ₹0.98, compared to ₹0.75 in the previous quarter and ₹0.94 in the same quarter last year. This indicates a challenging financial period for the company.
Looking Ahead
Despite the current financial difficulties, Tamilnadu Telecommunication Limited remains committed to its strategic goals and continues to explore opportunities for growth and improvement in the telecom sector. The company’s management is optimistic about future prospects and is focused on optimizing operational efficiencies to mitigate losses.
Source: NSE Corporate Announcement
Fundamental & Technical Analysis of Tamilnadu Telecommunication Limited
Tamilnadu Telecommunication Limited belongs to the Technology › Communication Equipment sector. Here’s a quick read on where the business and the stock stand today.
Tamilnadu moves sideways over three months, with neither buyers nor sellers taking control. Razor-thin margins below 5% make profitability extremely vulnerable — this business needs scale or pricing power urgently. 5 loss quarters over five years is a serious red flag — earnings quality is poor and recovery is not guaranteed. The stock holds at 28% of its 52-week range with RSI at 50. In other words, neither side has a clear edge right now. Price climbs recently despite 0.0% revenue growth and a PEG of 99.00. Consequently, either institutions position ahead of improvement or the move fades when earnings disappoint. Treat this as a trading signal, not an investment thesis. Check Fundamentals of Tamilnadu Telecommunication Limited.
ASTRAMICRO
Astra Microwave Products Limited Q2 & H1 FY27 Unaudited Financial Results
Astra Microwave Products Limited (ASTRAMICRO) Q2 FY27: Revenue up 22.5%, PAT surges 126.5%, strong order book.


Astra Microwave Products Limited (ASTRAMICRO) announced its unaudited financial results for the quarter ended 30th September 2026. The company reported a significant increase in revenue and profit for Q2 FY27 and H1 FY27. Notably, revenue from operations for Q2 FY27 grew by 22.5% year-on-year to Rs. 261 crores. The profit after tax (PAT) for the same quarter surged by 126.5% to Rs. 47 crores. For the first half of FY27, revenue from operations rose by 6.6% to Rs. 437 crores, while PAT increased by 68.3% to Rs. 57 crores.
Standalone and Consolidated Highlights
The company’s standalone order book stood at Rs. 3,937 crores as of September 30, 2026, while the consolidated order book was at Rs. 4,708 crores. The order book has a larger share of production orders for indigenous radar and electronic warfare platforms, providing strong revenue visibility and growth runway. The company remains focused on strengthening its position in India’s defence and aerospace ecosystem through indigenous product development and expansion into new opportunities.
Future Outlook
Mr. M V Reddy, Managing Director, highlighted that the first half of FY27 has been strong, with the highest ever reported EBITDA and PAT. The company will continue to invest in R&D and production capacity to meet the growing demand and achieve long-term aspirations.
Source: NSE Corporate Announcement
Fundamental & Technical Analysis of Astra Microwave Products Limited
Astra Microwave Products Limited belongs to the Technology › Communication Equipment sector. Here’s a quick read on where the business and the stock stand today.
Astra holds in the upper half of its 52-week range, a sign the market backs the stock. The PEG of 2.16 makes it expensive versus peers. The premium needs earnings to catch up quickly. Revenue grows at 12.6% and profits at 40.3% CAGR. However, that pace does not justify a premium multiple. The stock trades at 79% of its 52-week range — near its best levels of the year. Clearly, the market pays a premium for this name. The stock rises 1.6% in three months on 12.6% revenue growth. As a result, the market gives it more credit than the fundamentals strictly justify. Watch the next quarterly results. If growth accelerates, the move makes sense. If not, expect some gains to unwind. Check Fundamentals of Astra Microwave Products Limited.
-

 Health Information Services3 days ago
Indegene Limited (indgn) Becomes First Industry Partner of Indo-uk Life Science Corridor
-
 FSL2 days ago
Firstsource Solutions Limited (FSL) Partners with Sew.ai to Launch Smart Revenue Operations and Collections
-

 DREAMFOLKS3 days ago
Dreamfolks Strengthens its Southeast Asia Presence, Showcasing Travel & Lifestyle Experiences at Singapore Fintech Festival 2026
-

 Apparel Retail3 days ago
Arvind Fashions Limited: U.S. Polo Assn. Aims for ₹4,000 Crore Sales in FY27
-

 GREENPOWER3 days ago
Orient Green Power Company Limited (NSE: Greenpower) Wins ₹12.98 Crore Recovery in Legal Battle
-
 Basic Materials2 days ago
Valiant Organics Limited Q2 FY27 Earnings Presentation: Robust Growth in Revenue and Profit
-
 RAMCOSYS2 days ago
Ramco Systems Limited Goes Live with Canadian Coast Guard’s Aviation Software
-

 AWFIS3 days ago
Awfis Space Solutions Limited (awfis) Strengthens Leadership Team with Kumar Alok Gupta as Chief Business Officer National