
Basic Materials
Rain Industries Limited (NSE: RAIN) extends gains, moves up 5% intraday
Rain Industries Limited (NSE: RAIN) stock price moves up 5% intraday, showing strong upward momentum in the Basic Materials & Specialty Chemicals sector.

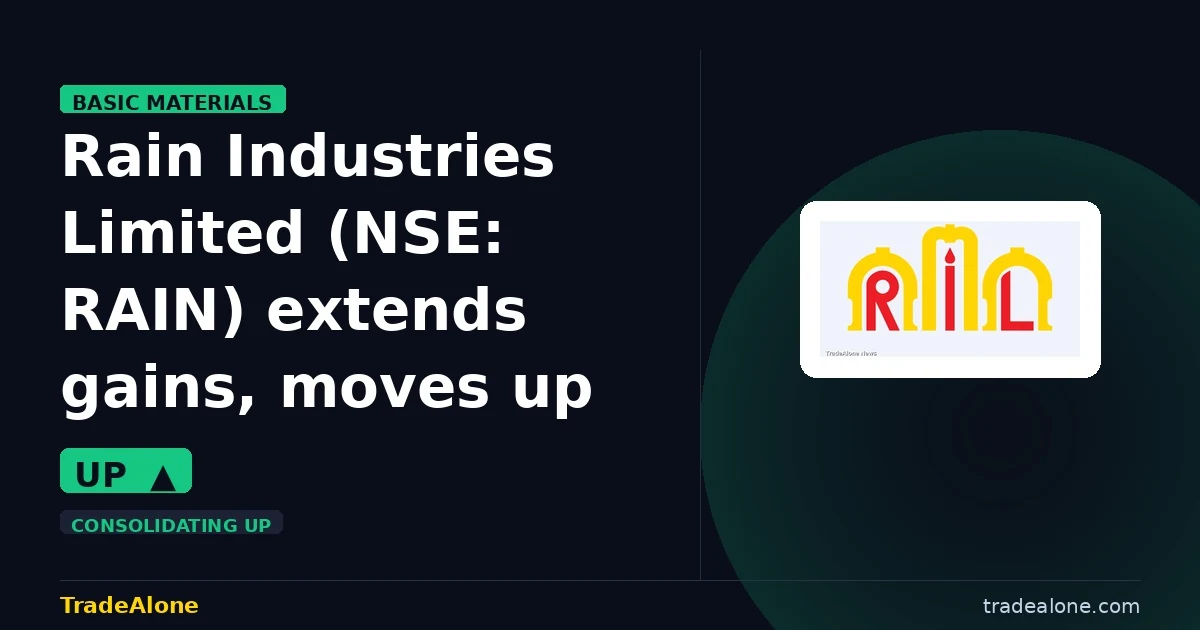
Rain Industries Limited (RAIN) stock extended gains by +5% to ₹218.11 on the NSE today, continuing its recovery from a recent breakdown. The move is technical, driven by the stock’s push higher within a consolidating uptrend. Rain Industries operates in the specialty chemicals segment of the basic materials sector, and today’s move appears to be company-specific rather than a sector-wide phenomenon.
Technical setup — trendlines & DMA
From a technical perspective, Rain Industries is currently trading above its 6-month support trendline at ₹208.62, with resistance at ₹234.94 still untested. The stock is 17% above its 50-day moving average (DMA) of ₹177.3, indicating an extended move. However, the 50-DMA is above the 200-DMA of ₹141.7, signaling a bullish trend. Rain Industries is in the upper third of its 52-week range, suggesting that a substantial portion of its recent gains may already be priced in.
Snapshot: ₹218.11 on 2026-07-13 (chart frozen at publication)
Fundamentals & business context
Despite today’s technical gains, Rain Industries faces fundamental challenges. With a PE ratio of 22.5 against a profit margin of just 1.7% and a revenue CAGR of -7.0%, the valuation appears stretched relative to current earnings. The company’s institutional ownership stands at 8.1%, indicating a cautious approach by smart money. There was no NSE catalyst today to explain the move, reinforcing its technical nature.
Algorithmic scorecard
The algorithmic scorecard paints a picture of technical strength but fundamental weakness. The stock’s bullish trend, as indicated by the 50-DMA being above the 200-DMA, and its strong bullish sentiment over the last 30 days, are positive signals. However, the company’s declining revenue and profit CAGRs, coupled with a low profit margin of 1.7%, highlight significant risks. The high debt level, with a D/E ratio of 1.24, and the negligible dividend yield of 0.49% further underscore the fundamental challenges facing Rain Industries.
Get all details on RAIN — P&L, peers, shareholding and more on TradeAlone.








Agricultural Inputs
Pi Industries Limited Unveils Pioxaniliprole, India’s First Indigenously Discovered Insecticide
PI Industries Limited (PIIND) unveils Pioxaniliprole, India’s first indigenously discovered insecticide, marking a significant milestone in agricultural inno.


PI Industries Limited (PIIND) has made a groundbreaking announcement today, unveiling Pioxaniliprole, India’s first indigenously discovered insecticide. This decade-long research breakthrough marks a defining milestone in India’s ability to originate world-class agricultural science and proprietary innovation.
A Milestone in Agricultural Innovation
Developed through more than a decade of original research, Pioxaniliprole demonstrates the country’s growing capability to originate novel scientific discoveries and create proprietary intellectual property. This achievement strengthens PI’s ambition to build a global, innovation-led Life Sciences company, creating original science and intellectual property from India for the world.
Significance Beyond a Single Molecule
The significance of Pioxaniliprole extends beyond a single molecule. It is the first outcome of a broader innovation pipeline at PI, spanning chemistry, biology, and biochemical solutions. Together, these mark an important step in India’s journey towards greater scientific self-reliance, strengthening indigenous research capabilities and creating opportunities for Indian-origin agricultural innovation to address challenges of global relevance.
Source: NSE Corporate Announcement
Fundamental & Technical Analysis of PI Industries Limited
PI Industries Limited belongs to the Basic Materials › Agricultural Inputs sector. Here’s a quick read on where the business and the stock stand today.
PI drops 16.5% over three months and trades near its 52-week lows. The PEG stands at 11.88 — severely stretched. Any earnings miss could trigger a sharp de-rating. Revenue grows at 1.1% CAGR. The company generates cash but does not compound aggressively. The stock sits at 5% of its 52-week range, close to annual lows. Historically, value investors build positions at these levels — though cheap stocks can stay cheap. Revenue grows at 1.1% and the stock moves sideways over three months. Neither side makes a strong case. The next earnings print will likely break this stock out of its current range. Check Fundamentals of PI Industries Limited.
Basic Materials
Kotyark Industries Limited (kotyark) Q2 FY27: PAT Surges 148% Yoy to ₹6.24 Crore; Ebitda Margin Expands to 20.72%
Kotyark Industries Limited (NSE: KOTYARK) announced Q2 FY27 results with a 148% YoY surge in PAT to ₹6.24 Crore, and a 20.72% EBITDA margin.

Kotyark Industries Limited (NSE: KOTYARK), a biodiesel manufacturing company, announced its unaudited financial results for the quarter and half year ended September 30, 2026 (Q2 & H1 FY27), as approved by the Board of Directors at its meeting held on October 28, 2026. This release discusses consolidated performance. In Q2 FY27, consolidated revenue from operations was ₹61.27 Crore, 5.5% lower than Q2 FY26, while EBITDA rose 50.7% to ₹12.70 Crore and Profit After Tax (PAT) increased 147.6% to ₹6.24 Crore. The EBITDA margin improved to 20.72% of total income from 12.99%, and the PAT margin to 10.18% from 3.88%. For H1 FY27, total revenue grew 4.0% to ₹153.28 Crore and PAT grew 61.9% to ₹10.70 Crore.
Q2 FY27 Consolidated Financial Results
In Q2 FY27, consolidated financial results showed a significant improvement in profitability. Despite a 5.5% year-on-year decline in revenue, EBITDA increased 50.7% to ₹12.70 Crore and Profit After Tax (PAT) rose 147.6% to ₹6.24 Crore. Total expenses declined 14.2% to ₹52.93 Crore from ₹61.71 Crore in the corresponding quarter last year.
H1 FY27 Consolidated Financial Results
For H1 FY27, revenue from operations grew 4.0% to ₹153.25 Crore, EBITDA increased 30.2% to ₹24.41 Crore and PAT rose 61.9% to ₹10.70 Crore, reflecting improved profitability over the half year. Looking ahead, Kotyark Industries Limited is targeting revenue CAGR of 25 – 30% over the next three years, with an EBITDA margin aspiration of 18 -22%. Growth is expected to be supported by higher biodiesel volumes, improved plant utilisation, operating efficiencies, integrated sourcing advantages and a greater contribution from value added products.
Source: NSE Corporate Announcement
Fundamental & Technical Analysis of Kotyark Industries Limited
Kotyark Industries Limited belongs to the Basic Materials › Specialty Chemicals sector. Here’s a quick read on where the business and the stock stand today.
Kotyark falls 8.7% over three months and has not found a floor yet. Thin margins at 6.1% leave limited room for error — any demand softness or cost spike hits the bottom line hard. Revenue consistency is the one bright spot — zero dips in five years shows operational resilience. The stock holds at 50% of its 52-week range with RSI at 44. In other words, neither side has a clear edge right now. The stock rises -8.7% in three months on 34.1% revenue growth. As a result, the market gives it more credit than the fundamentals strictly justify. Watch the next quarterly results. If growth accelerates, the move makes sense. If not, expect some gains to unwind. Check Fundamentals of Kotyark Industries Limited.
Basic Materials
Nocil Limited Q2fy27: Revenue Up 33%, Net Profit Surges 98%
NOCIL LIMITED reports strong Q2FY27 results with a 33% revenue growth and a 98% surge in net profit, driven by strategic initiatives.

NOCIL LIMITED has announced its Q2FY27 results, showcasing a robust financial performance. The company reported a 33% year-on-year revenue growth and a 98% surge in net profit for the quarter. These impressive figures are a testament to NOCIL’s strategic initiatives and operational excellence.
Strategic Growth and Operational Excellence
NOCIL’s market deepening presence and disciplined investment approach have played a crucial role in its financial success. The company’s focus on innovation, portfolio expansion, and digitalization has kept it competitive and ready for evolving customer and regulatory needs. Additionally, NOCIL’s emphasis on operational excellence has led to improved productivity, cost optimization, and enhanced manufacturing efficiency.
Financial Highlights
The financial highlights of Q2FY27 reveal a net revenue of Rs. 427 crores, up from Rs. 321 crores in Q2FY26. The company’s net profit rose to Rs. 24 crores, compared to Rs. 12 crores in the same quarter last year. The operating EBITDA margin stood at 8.4%, reflecting the company’s strong performance in managing costs and generating earnings.
As NOCIL continues to build on its strategic levers, it remains optimistic about its future growth prospects. The company expects to close FY27 revenue towards the upper range of the guided bracket, with EBITDA margins of around 10%.
Source: NSE Corporate Announcement
Fundamental & Technical Analysis of NOCIL Limited
NOCIL Limited belongs to the Basic Materials › Specialty Chemicals sector. Here’s a quick read on where the business and the stock stand today.
NOCIL posts a 1.9% three-month gain, but softens in the last few weeks. Razor-thin margins below 5% make profitability extremely vulnerable — this business needs scale or pricing power urgently. Revenue contracts at -7.4% CAGR. That signals structural headwinds, not a short-term blip. The stock gives back 8.9% in the last month despite a positive three-month run. As a result, the earlier momentum appears to be fading. The stock holds up despite -7.4% revenue growth and a PEG of 99.00. That could signal an early turnaround. Alternatively, index flows simply support the price. Watch whether analysts revise estimates upward — that is the real signal. Check Fundamentals of NOCIL Limited.
-

 AWL2 days ago
Awl Agri Business Limited (AWL) Delivers Strong Q2 FY27 Growth; Revenue Grows 26% to INR 22,202 Crore with Operating Ebitda Up 11% Yoy
-

 Consumer Cyclical2 days ago
Sky GOLD and Diamonds Limited (NSE: Skygold) Q2 and H1 FY27: Revenue at Rs 4,403.45 Crore, PAT Up 111.9%
-

 ACUTAAS2 days ago
Acutaas Chemicals Limited (acutaas) Q2 & H1 FY27 Results: Revenue Up 42.7% Yoy, PAT Surges 71.4%
-

 DYCL2 days ago
Dynamic Cables Limited (dycl) Scaling with Strength: Q2 FY27 Results Show Strong Growth
-

 Industrials2 days ago
Navkar Corporation Limited Announces Q2 FY27 Results: Revenue Up 15%, Ebitda Surges 20%
-

 Consumer Cyclical2 days ago
Huhtamaki India Limited Q3 FY26: Net Sales Surge 23.7%, EBIT Up 18%
-

 Auto Parts2 days ago
Schaeffler India Limited (NSE: Schaeffler) Q3 FY26: Double-digit Growth Across Domestic and Export Businesses
-
 Consumer Cyclical2 days ago
Siyaram Silk Mills Limited Q2 & H1 FY27 Results: Revenue Up 15.1% in Q2 FY27