
Healthcare
Sudeep Pharma Limited (SUDEEPPHRM) breaks out +8%
Sudeep Pharma Limited (NSE: SUDEEPPHRM) stock price jumped +8% to ₹815.85, breaking out in a fresh intraday computation.

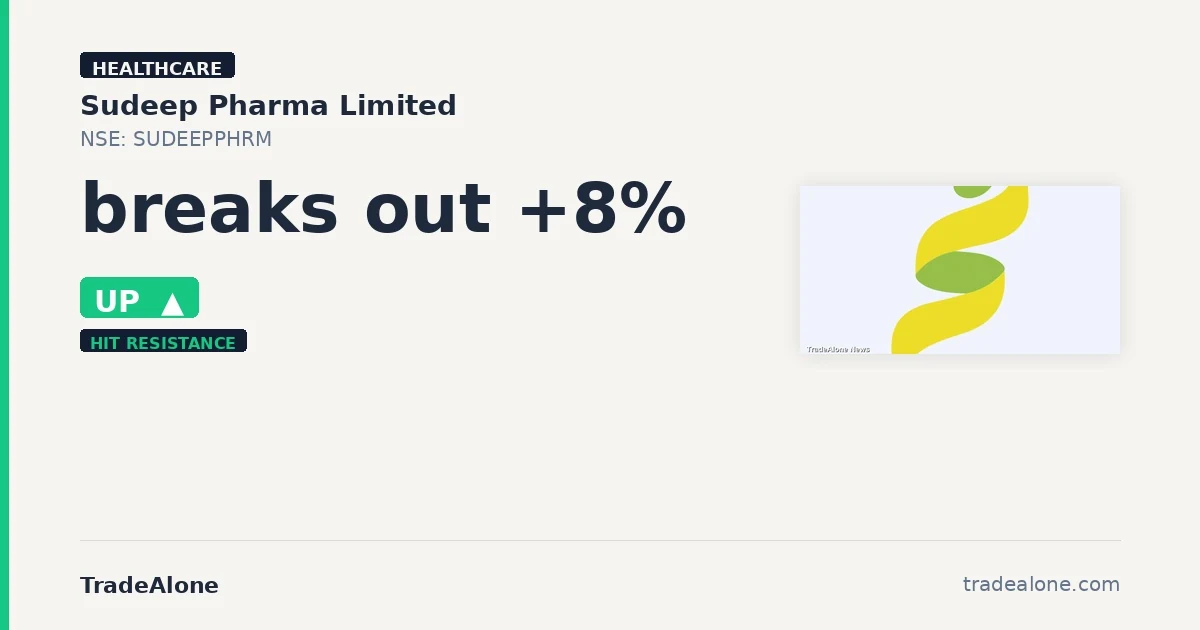
Sudeep Pharma Limited (SUDEEPPHRM) gained +8% to ₹815.85 on the NSE on 15 Jun 2026. The stock’s trendline status shifted from APPROACHING RESISTANCE to HIT RESISTANCE, with the resistance level at ₹810. Sudeep Pharma operates in the healthcare sector, specifically in drug manufacturing, and today’s move appears to be driven by technical factors rather than sector momentum.
Technical setup — trendlines & DMA
From a technical standpoint, Sudeep Pharma’s 6-month support trendline ends at ₹655.39, which is 19.67% below today’s price. The resistance trendline at ₹810.13 has been breached by 0.70%. The stock is currently trading 21.18% above its 50-DMA of ₹678.8 and 27.93% above its 200-DMA of ₹643.0, indicating a stretched move. Within the 52-week range of ₹524.0 to ₹824.5, the stock is in the upper third, suggesting that a significant portion of the move may already be priced in.
Snapshot: ₹815.85 on 2026-06-15 (chart frozen at publication)
Fundamentals & business context
With a PE of 55.1, Sudeep Pharma’s valuation appears elevated given its profit margin of 26.9% and a revenue CAGR of 24.0%. This suggests that the market may be pricing in future growth expectations rather than current earnings. The institutional ownership of 8.0% indicates a cautious approach by smart money, possibly due to the stock’s stretched valuation. There was no NSE catalyst today, and the move is primarily technical.
Algorithmic scorecard
The overall algorithmic scorecard reflects a balanced view of Sudeep Pharma, with strong technical indicators offset by some fundamental weaknesses. The strongest signals include the excellent revenue and profit CAGRs, which highlight the company’s robust growth trajectory, and the very low debt levels, indicating strong financial health. On the weaker side, the negligible dividend yield suggests limited income generation for investors, and the overbought RSI at 71.9 warns of potential pullbacks. These factors together paint a picture of a growth-oriented stock with some inherent risks.
Company outlook
Management expects the pharma food and nutrition segment to grow faster than 10% in FY27 and anticipates margins to return to historical average levels of 24-25% in the next couple of quarters. They also plan to commission a new greenfield facility and scale up their battery materials project at Dahej, with Phase 1 capacity of 25,000 metric tons per year by April 2027.
Get all details on SUDEEPPHRM — P&L, peers, shareholding and more on TradeAlone.










Healthcare
Hikal Limited (NSE: Hikal) Secures Swissmedic GMP Certification for Bengaluru API Facility
Hikal Limited (NSE: HIKAL) announces Swissmedic GMP certification for Bengaluru API facility, enhancing global market access.

Hikal Limited (NSE: HIKAL) announced today that Swissmedic, the Swiss Agency for Therapeutic Products, has granted a Certificate of GMP Compliance to its active pharmaceutical ingredient (API) facility in Bengaluru. This certification confirms the facility’s adherence to Good Manufacturing Practice (GMP) requirements under the Mutual Recognition Agreement between the European Union and Switzerland. The certification follows successful inspections by Brazil’s ANVISA and Japan’s PMDA, reinforcing the site’s standing with leading global regulators.
Enhanced Global Regulatory Standing
The Swissmedic certification strengthens Hikal’s global regulatory standing and expands access to European and other regulated markets. This development is a significant step in the company’s strategy to diversify its geographic footprint in the pharmaceutical business, building resilience against geopolitical and trade uncertainties.
Strategic Importance
Commenting on the development, Mr. Sameer Hiremath, Chairman & Managing Director of Hikal Limited, stated: ‘The Swissmedic certification is a strong endorsement of the quality systems at our Bengaluru facility. It is an important step in expanding the global reach of our pharmaceutical business and opens new opportunities with customers in Europe and other regulated markets. Quality, compliance, and manufacturing excellence remain the foundation of our long-term customer partnerships.’ This recognition is part of Hikal’s broader strategy to enhance its global presence and cater to a wider customer base across regulated markets.
Source: NSE Corporate Announcement
Fundamental & Technical Analysis of Hikal Limited
Hikal Limited belongs to the Healthcare › Drug Manufacturers – Specialty & Generic sector. Here’s a quick read on where the business and the stock stand today.
Hikal holds in the upper half of its 52-week range, a sign the market backs the stock. Razor-thin margins below 5% make profitability extremely vulnerable — this business needs scale or pricing power urgently. 4 loss quarters over five years is a serious red flag — earnings quality is poor and recovery is not guaranteed. The stock holds at 60% of its 52-week range with RSI at 48. In other words, neither side has a clear edge right now. The stock holds up despite -5.4% revenue growth and a PEG of 99.00. That could signal an early turnaround. Alternatively, index flows simply support the price. Watch whether analysts revise estimates upward — that is the real signal. Check Fundamentals of Hikal Limited.
Healthcare
Sun Pharmaceutical Industries Limited (sunpharma) Gets FDA Approval for Ilumya® for Psoriatic Arthritis
Sun Pharma’s ILUMYA® gains FDA approval for treating psoriatic arthritis, expanding its therapeutic portfolio and benefits for patients.

Sun Pharmaceutical Industries Limited (SUNPHARMA) announced today that the U.S. Food and Drug Administration (FDA) has approved the supplemental Biologics License Application (sBLA) for ILUMYA® (tildrakizumab-asmn) for the treatment of adults with active psoriatic arthritis (PsA). This approval marks a significant milestone for Sun Pharma, expanding the use of ILUMYA beyond moderate-to-severe plaque psoriasis.
Expanding Therapeutic Reach
ILUMYA, an IL-23 inhibitor, is now an option for adults with active psoriatic arthritis who require healthcare provider-administered treatment. This approval is supported by Phase 3 INSPIRE-1 and INSPIRE-2 clinical studies, which demonstrated the efficacy and safety of ILUMYA after two doses at 24 weeks in adult patients with active psoriatic arthritis.
Clinical Insights and Safety
The safety data in the studies were consistent with the well-documented safety profile of ILUMYA. No new safety signals were identified. However, ILUMYA may increase the risk of infection, and patients should be evaluated for tuberculosis (TB) infection prior to initiating treatment. The most common adverse reactions include upper respiratory infections, injection site reactions, and diarrhea for plaque psoriasis, and upper respiratory tract infections and COVID-19 for psoriatic arthritis.
This approval underscores Sun Pharma’s commitment to addressing complex chronic diseases and providing innovative therapeutic options for patients. With this milestone, Sun Pharma continues to strengthen its portfolio in psoriatic disease, offering hope and improved management for millions affected by these conditions.
Source: NSE Corporate Announcement
Fundamental & Technical Analysis of Sun Pharmaceutical Industries Limited
Sun Pharmaceutical Industries Limited belongs to the Healthcare › Drug Manufacturers – Specialty & Generic sector. Here’s a quick read on where the business and the stock stand today.
Sun falls 9.0% over three months and has not found a floor yet. The PEG reaches 3.29. The stock trades on brand and index weight, not on growth. Premium net margins of 20.2% demonstrate strong cost discipline and a wide competitive moat. The stock holds at 38% of its 52-week range with RSI at 37. In other words, neither side has a clear edge right now. Revenue grows at 10.4% and profits at 10.6% CAGR, with D/E of 0.03. Meanwhile, the stock dips 9.0% in three months without any fundamental deterioration. Consequently, the stock quietly becomes cheaper relative to earnings power. For long-term investors, that is a feature. Check Fundamentals of Sun Pharmaceutical Industries Limited.
Health Information Services
Indegene Limited (indgn) Q2 FY27: Revenue Up 39.5% Yoy, H1 USD Revenue Growth at Four-year High
Indegene Limited (INDGN) reports strong Q2 FY27 performance with 39.5% YoY revenue growth and H1 USD revenue hitting a four-year high.
Indegene Limited (INDGN), the strategic operating partner to the global life sciences industry, announced its financial results for the quarter ended September 30, 2026. Indegene’s Q2 FY27 performance showcased a robust revenue growth of 39.5% year-on-year (YoY) in INR, translating to a 27.5% YoY increase in USD. This marks the fifth successive quarter of above 5% sequential growth. The company’s revenue for the quarter stood at ₹11,223 million ($117.5 million), with an EBITDA of ₹1,873 million, marking a 32.0% YoY increase. Moreover, H1 USD revenue growth reached a four-year high, reflecting the company’s sustained deal momentum and favorable industry tailwinds.
Revenue and Profitability
Indegene’s revenue from operations increased significantly to ₹11,223 million, up from ₹8,042 million in the same quarter last year. The company’s EBITDA margin remained stable at 16.7%, despite wage hikes, while the profit after tax (PAT) grew by 10% YoY to ₹1,123 million. This strong performance is attributed to the expansion across top accounts and an increase in the number of $1 million+ clients to 59, including 13 in the $10M+ range.
Growth and Future Outlook
Manish Gupta, Chairman and CEO of Indegene, highlighted the company’s broad-based growth driven by expansion across top accounts and significant deal wins in GenAI-enabled transformation and upstream engagements. Suhas Prabhu, CFO, noted that with a healthy pipeline and sustained deal momentum, Indegene expects growth and margin expansion to come together in the second half. The company anticipates EBITDA to grow faster than revenue in the coming quarters, supported by higher yields on investments and lower amortization.
Source: NSE Corporate Announcement
Fundamental & Technical Analysis of Indegene Limited
Indegene Limited belongs to the Healthcare › Health Information Services sector. Here’s a quick read on where the business and the stock stand today.
Indegene gains 17.1% over three months and trades near its 52-week highs. The PEG of 2.45 makes it expensive versus peers. The premium needs earnings to catch up quickly. Revenue consistency is the one bright spot — zero dips in five years shows operational resilience. The stock trades at 86% of its 52-week range — near its best levels of the year. Clearly, the market pays a premium for this name. The stock rises 17.1% in three months on 15.0% revenue growth. As a result, the market gives it more credit than the fundamentals strictly justify. Watch the next quarterly results. If growth accelerates, the move makes sense. If not, expect some gains to unwind. Check Fundamentals of Indegene Limited.
-

 Consumer Cyclical2 days ago
Sky GOLD and Diamonds Limited (NSE: Skygold) Q2 and H1 FY27: Revenue at Rs 4,403.45 Crore, PAT Up 111.9%
-

 AWL3 days ago
Awl Agri Business Limited (AWL) Delivers Strong Q2 FY27 Growth; Revenue Grows 26% to INR 22,202 Crore with Operating Ebitda Up 11% Yoy
-

 Consumer Cyclical3 days ago
Kanpur Plastipack Limited (NSE: Kanprpla) Q2 FY27: Revenue, Ebitda & PAT Surge
-

 Consumer Cyclical3 days ago
Huhtamaki India Limited Q3 FY26: Net Sales Surge 23.7%, EBIT Up 18%
-

 DYCL3 days ago
Dynamic Cables Limited (dycl) Scaling with Strength: Q2 FY27 Results Show Strong Growth
-

 ACUTAAS3 days ago
Acutaas Chemicals Limited (acutaas) Q2 & H1 FY27 Results: Revenue Up 42.7% Yoy, PAT Surges 71.4%
-

 Auto Parts3 days ago
Schaeffler India Limited (NSE: Schaeffler) Q3 FY26: Double-digit Growth Across Domestic and Export Businesses
-

 Industrials3 days ago
Navkar Corporation Limited Announces Q2 FY27 Results: Revenue Up 15%, Ebitda Surges 20%