
ACUTAAS
Acutaas Chemicals Limited Inaugurates Indichem’s Semiconductor Materials Plant
Acutaas Chemicals Limited inaugurates Indichem’s semiconductor materials plant in Gongju, South Korea, marking a strategic expansion.

Acutaas Chemicals Limited (BSE: 543349, NSE: ACUTAAS), a leading India-based manufacturer of specialty chemicals and pharmaceutical intermediates, announced the inauguration of its step-down subsidiary Indichem Inc.’s semiconductor materials plant at Gongju, South Korea. The plant, inaugurated today, was built in just eleven months and will synthesize chemicals in India and refine them to semiconductor grade in South Korea.
State-of-the-Art Facility
The semiconductor materials plant was inaugurated at a ceremony held today at the facility. The plant, completed within 11 months of its groundbreaking on September 29, 2025, spans 16,513.7 sq. m. across three buildings, including a main production block, combined headquarters/R&D/pilot plant, and warehouse. Additional land is available on-site for future expansion.
Strategic Two-Country Model
A synergistic two-country model has been adopted, where chemicals are synthesized in India and refined to semiconductor grade in South Korea. This model leverages India’s strengths in complex chemical synthesis and South Korea’s expertise in ultra-high-purity refining. This approach aims to create a resilient and geographically diversified supply chain for global chip and display makers.
Speaking on the occasion, Mr. Naresh Patel, Chairman & Managing Director of Acutaas Chemicals Limited, said: “We are thrilled to inaugurate the Gongju plant just eleven months after breaking ground, reflecting the exceptional discipline brought by both partners. By combining India’s core strengths in complex chemical synthesis with Korea’s expertise in ultra-high-purity refining, we have built a synergistic model that neither company could have executed alone. This marks a vital step in scaling our semiconductor materials business into a long-term growth engine for Acutaas.”
Source: NSE Corporate Announcement
Fundamental & Technical Analysis of Acutaas Chemicals Limited
Acutaas Chemicals Limited belongs to the Basic Materials › Specialty Chemicals sector. Here’s a quick read on where the business and the stock stand today.
Acutaas holds in the upper half of its 52-week range, a sign the market backs the stock. The PEG reaches 3.16. The stock trades on brand and index weight, not on growth. Industry-leading margins of 26.4% reflect exceptional pricing power and operational efficiency. The stock trades at 83% of its 52-week range — near its best levels of the year. Clearly, the market pays a premium for this name. Revenue grows at 24.3% and profits at 30.2%. The business is in good shape. Moreover, a stock that does not move despite strong fundamentals often offers better value than one already priced for perfection. Check Fundamentals of Acutaas Chemicals Limited.












ACUTAAS
Acutaas Chemicals Limited (ACUTAAS) breaks below support, falls 5%
Acutaas Chemicals Limited (NSE: ACUTAAS) experiences a 5% drop intraday, breaking below support at ₹3192.0.

Acutaas Chemicals Limited (ACUTAAS) breaks below support, falling -5% today. The stock has breached its 6-month support trendline, signaling a breakdown in the technical structure. Acutaas operates in the specialty chemicals segment of the basic materials sector, and today’s move appears to be company-specific rather than a sector-wide phenomenon.
Technical setup — trendlines & DMA
The 6-month support trendline for Acutaas was at ₹3669.98, and the stock is now trading 14.97% below this level, indicating a breakdown. Resistance is further up at ₹3918.2, which is 22.75% above the current price. The 50-day moving average (DMA) is at ₹3276.9, slightly above the current price, while the 200-DMA is at ₹2331.9, well below. This suggests that while the stock is in a bullish trend in the longer term, it is currently under pressure. The stock is in the upper third of its 52-week range, implying that a significant portion of its yearly gains may already be priced in.
Snapshot: ₹3,192.00 on 2026-07-28 (chart frozen at publication)
Fundamentals & business context
With a PE ratio of 96.6, Acutaas is trading at a high multiple relative to its profit margin of 26.4% and revenue CAGR of 24.3%. This suggests that the market may be pricing in future growth expectations, potentially stretching the current valuation. Institutional ownership stands at 27.9%, indicating a moderate level of confidence from smart money. There is no NSE catalyst today, and the move is primarily technical.
Algorithmic scorecard
The overall scorecard reflects a balanced view, with strong revenue and profit growth but concerns over valuation and dividend yield. The strongest signals are the excellent revenue and profit CAGRs, indicating robust business performance and consistent growth. The weak signals include the overvalued PEG ratio and negligible dividend yield, which suggest that the stock may be expensive relative to its growth rate and offers little income to shareholders.
Company outlook
Management guided for 25% revenue growth in FY ’27 and expects to maintain EBITDA margins at a similar level. The battery chemical business and four validated CDMO products are expected to contribute meaningfully to revenue. The company plans to complete the second phase of electrolyte additive capex by Q1 FY ’27 and is evaluating land acquisition opportunities for new infrastructure.
Get all details on ACUTAAS — P&L, peers, shareholding and more on TradeAlone.
ACUTAAS
Acutaas Chemicals Limited (ACUTAAS) rises 5% intraday despite breakdown
Acutaas Chemicals Limited (NSE: ACUTAAS) moves up 5% intraday to ₹3442.0, despite a breakdown trendline status. The stock is nearing the 50-DMA at ₹3266.4.

Acutaas Chemicals Limited (ACUTAAS) bounced intraday by +5% to ₹3442.0 on the NSE today, recovering despite a weak 6-month trendline structure that remains in breakdown. This move comes as the stock tests its 50-day moving average at ₹3266.4, a key momentum level. Acutaas operates in the specialty chemicals segment of the basic materials sector, and today’s bounce appears to be more company-specific than a reflection of broader sector momentum.
Technical setup — trendlines & DMA
The current 6-month trendline structure for Acutaas shows a breakdown, with the stock trading below both its support and resistance levels. The 6-month support trendline ends at ₹3565.65, which is 3.59% above today’s price, while the resistance trendline is at ₹3918.2, 13.83% above. The stock’s 50-day moving average (DMA) of ₹3266.4 is above the 200-DMA of ₹2323.9, indicating a bullish trend, though the stock is currently just above the 200-DMA, suggesting a recovery phase. Acutaas is trading in the upper third of its 52-week range, indicating that a significant portion of its potential move may already be priced in.
Snapshot: ₹3,442.00 on 2026-07-27 (chart frozen at publication)
Fundamentals & business context
With a PE ratio of 93.3, Acutaas Chemicals appears richly valued, especially given its profit margin of 26.6% and revenue CAGR of 32.0%. This suggests that the market may be pricing in aggressive future growth expectations, which could stretch the current valuation relative to the company’s current earnings. The 27.9% institutional ownership indicates a degree of confidence from sophisticated investors, though the lack of a specific NSE catalyst today suggests that the move may be more technical in nature.
Algorithmic scorecard
The overall algorithmic scorecard for Acutaas reflects a balanced but cautious outlook. The strongest signals include the excellent revenue and profit CAGRs, which underscore the company’s robust growth trajectory, and the very low debt levels, indicating strong financial health. On the flip side, the overvalued PEG ratio of 2.03 and the negligible dividend yield of 0.04% highlight potential risks. The PEG ratio suggests that the stock may be expensive relative to its growth rate, while the low dividend yield offers little income for investors seeking regular returns.
Company outlook
Management has guided for a 25% revenue growth in FY ’27, with expectations to maintain EBITDA margins at a similar level. The company anticipates meaningful revenue contributions from its battery chemical business and four validated CDMO products in the coming year. Additionally, Acutaas plans to complete the second phase of electrolyte additive capex by Q1 FY ’27 and is evaluating land acquisition opportunities to develop new infrastructure. These initiatives underscore the company’s focus on expanding its core businesses and enhancing its production capabilities.
Get all details on ACUTAAS — P&L, peers, shareholding and more on TradeAlone.
ACUTAAS
Acutaas Chemicals Limited (acutaas) Q1 FY27: Revenue Up 59.1% Yoy, PAT Rises 70.4%
Acutaas Chemicals Limited (ACUTAAS) reports Q1 FY27 results with revenue up 59.1% YoY to ₹3,297mn, PAT rises 70.4% to ₹750mn.
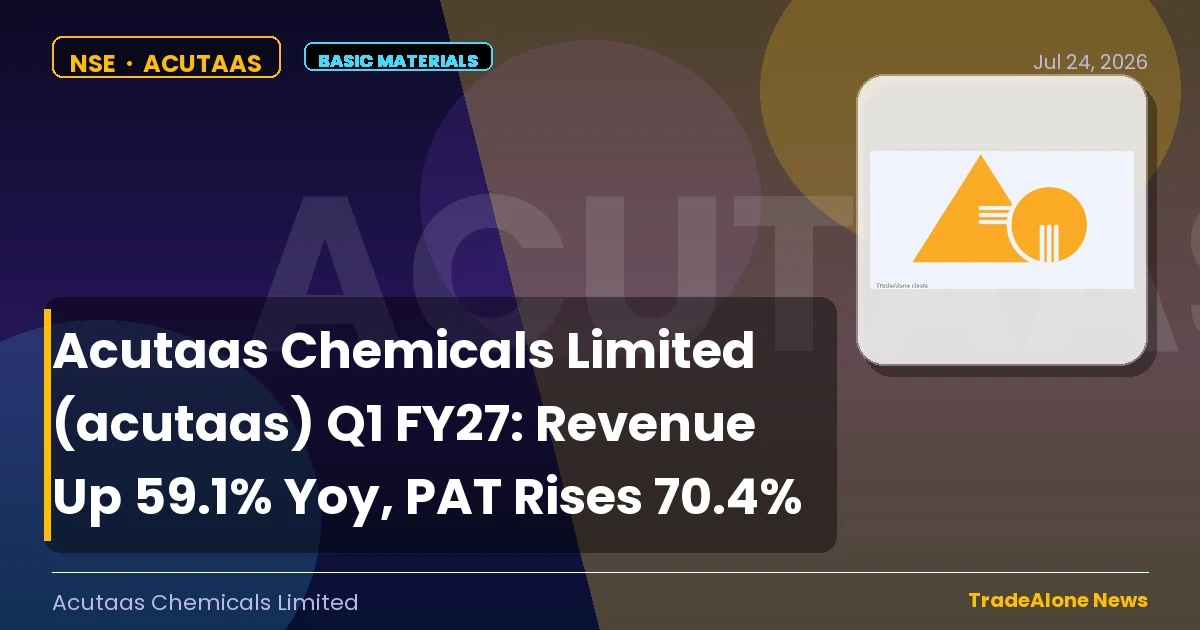
Acutaas Chemicals Limited (NSE: ACUTAAS), a leading global manufacturer of advanced pharmaceutical intermediates and specialty chemicals, today announced financial results for the quarter ended June 30, 2026. The company reported a significant growth in revenue from operations, which grew 59.1% year-over-year (YoY) to ₹3,297 million. This impressive performance was driven by the agility of the business model and the company’s ability to deliver on time and without compromise.
Key Financial Highlights
The company’s profit after tax (PAT) for Q1 FY27 surged 70.4% YoY to ₹750 million, reflecting robust operational efficiency. The gross profit for the quarter improved to ₹1,909 million, marking a 73.0% increase YoY. The EBITDA for the quarter stood at ₹1,131 million, up 122.1% YoY, while the EBITDA margin expanded to 34.3%.
Management Commentary
Commenting on the results, Mr. Naresh Patel, Executive Chairman & Managing Director, said, “We have started the year on a strong note, with revenue from operations growing 59.1% YoY to Rs. 3,297 mn — reflecting the agility of our business model and our ability to keep delivering to customers, on time and without compromise. We have also been certified as a Great Place to Work — a recognition of the culture of trust, collaboration and pride our people have built, and a proud validation of the team behind all we have achieved. We have further received the Responsible Care certification from the Indian Chemical Council — the industry’s commitment to the highest standards of safety, health and environmental performance — reaffirming our resolve to grow responsibly and sustainably. Overall, we remain confident of delivering 25% revenue growth for the full year with stable margins.”
Acutaas Chemicals Limited remains optimistic about its future growth trajectory, aiming for a 25% revenue increase for the full fiscal year with stable margins.
Source: NSE Corporate Announcement
Fundamental & Technical Analysis of Acutaas Chemicals Limited
Acutaas Chemicals Limited belongs to the Basic Materials › Specialty Chemicals sector. Here’s a quick read on where the business and the stock stand today.
Acutaas gains 44.4% over three months and trades near its 52-week highs. Industry-leading margins of 26.6% reflect exceptional pricing power and operational efficiency. Revenue grows at 32.0% and profits at 46.0% CAGR. Both numbers are exceptional. The stock trades at 89% of its 52-week range — near its best levels of the year. Clearly, the market pays a premium for this name. The business grows revenue at 32.0% and profits at 46.0%, with D/E of 0.00. The stock reflects that strength. Moreover, when fundamentals and price action align, the PEG of 2.16 premium is usually justified. Check Fundamentals of Acutaas Chemicals Limited.
-

 Industrials3 days ago
Oswal Pumps Limited to Establish 1.2 GW Topcon Solar Cell Manufacturing Facility
-
 Consumer Cyclical2 days ago
P N Gadgil Jewellers Limited PNGJL Inaugurates 81st Store in Ayodhya with Kangana Ranaut
-
 Real Estate3 days ago
Signatureglobal (india) Limited Reports Pre-sales of INR 18.3 Billion in Q2fy27
-

 GODREJPROP2 days ago
Godrej Properties Limited (godrejprop) Inaugurates First Milestone of Bandra Bay Transformation
-

 DREAMFOLKS2 days ago
Dreamfolks Services Limited Launches Dreamfolks Club Nagavalli Wilderness Estate in the Eastern Ghats
-
 Banks - Regional1 day ago
Rbl Bank Limited (rblbank) Q2 FY27: Net Profit Surges 170% Yoy
-
 AEQUS1 day ago
Aequs Limited (aequs) Announces Long-term Supply Agreements with Safran for Aerospace Applications
-
 Consumer Cyclical24 hours ago
Crompton Greaves Consumer Electricals Limited Launches Instanourish Pro Multi Purpose Kettle