
Capital Markets
Indian Energy Exchange Limited (NSE: IEX) breaks out, gains 5% intraday
Indian Energy Exchange Limited (NSE: IEX) stock clears its 6M resistance trendline, moving up 5% intraday to ₹125.05.

Indian Energy Exchange Limited (IEX) breaks out with a +5% gain to ₹125.05 on the NSE, clearing its 6-month resistance trendline. This move follows the company’s announcement of the filing of the Draft Red Herring Prospectus (DRHP) of Indian Gas Exchange Limited, an associate company, with SEBI and BSE on July 14, 2026. IEX, a key player in India’s energy trading sector, has shown resilience despite the broader market’s volatility, indicating a company-specific catalyst rather than sector-wide momentum.
Technical setup — trendlines & DMA
From a technical standpoint, IEX has broken through its 6-month resistance trendline, which ended at ₹121.38, marking a definitive breakout. The stock is now trading 2.93% above this resistance level, signaling a potential shift in momentum. However, it’s important to note that the 50-day moving average (DMA) at ₹124.6 is still below the 200-DMA at ₹130.5, indicating a bearish trend in the longer term. The stock is currently in the lower third of its 52-week range, suggesting that while there’s room for further upside, the move today might be a relief rally rather than a full recovery.
Snapshot: ₹125.05 on 2026-07-16 (chart frozen at publication)
Fundamentals & business context
On the fundamental front, IEX presents a compelling case with a PE of 21.8, underpinned by robust profit margins of 66.0% and a revenue CAGR of 15.4% over the past five years. This suggests that the market is pricing in the company’s strong earnings potential and consistent revenue growth. With 33.3% institutional ownership, it’s clear that smart money sees value in IEX, despite the recent volatility. Today’s move, driven by the DRHP filing, underscores the market’s positive reaction to strategic initiatives that could unlock future growth.
Algorithmic scorecard
The algorithmic scorecard for IEX reflects a balanced view, with strong fundamental signals offsetting weaker technical indicators. The standout fundamental strengths include excellent revenue and profit growth, with CAGRs of 15.4% and 17.2% respectively, and a very low debt-to-equity ratio of 0.00, indicating solid financial health. Additionally, the company’s perfect record of consistent revenue growth every year showcases exceptional business stability. On the flip side, the technical weaknesses are evident in the bearish trend, with the 50-DMA below the 200-DMA, and the stock trading near its yearly lows, reflecting recent underperformance. These contrasting signals suggest that while IEX has strong underlying fundamentals, caution is warranted given the current technical setup.
Company outlook
Looking ahead, IEX has provided forward-looking guidance that underscores its growth trajectory. The company expects to maintain volume growth of 15% to 20% in FY27, contingent on demand-supply dynamics. While IGX volumes may face headwinds due to geopolitical challenges in the Middle East, domestic offsets could mitigate some of the impact. Notably, IEX anticipates an increase in green energy participation as renewable energy installations grow, aligning with the broader trend towards sustainable energy sources. Additionally, IEX is exploring the establishment of a coal exchange, in line with the proposed Coal Regulations 2025, which could open new avenues for growth. These strategic initiatives and growth expectations position IEX for continued expansion in the energy trading sector.
Get all details on IEX — P&L, peers, shareholding and more on TradeAlone.







ANGELONE
Angel One Limited (NSE: Angelone) Q2 FY27: Revenue and PAT Surge, Client Funding Book Hits ₹74.5 Bn
Angel One Limited (NSE: ANGELONE) announced impressive Q2 FY27 results with revenue and PAT up, client funding book at ₹74.5 bn.

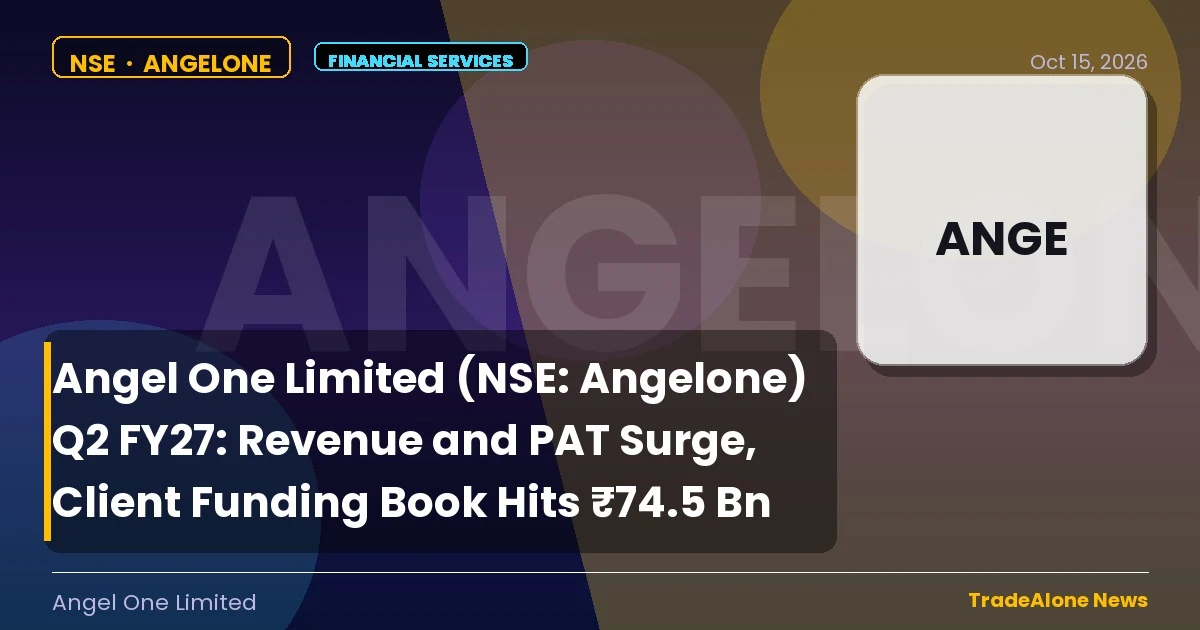
Angel One Limited (NSE: ANGELONE) announced its unaudited standalone and consolidated financial results for the quarter and half year ended 30th September 2026. The company reported significant growth in gross revenues, earnings before debt, taxes, depreciation, and amortization (EBDAT), and profit after tax (PAT). Notably, the average client funding book reached a new high of ₹74.5 billion, up 40.5% year-on-year.
Revenue and Profit Surge
The company’s total gross revenues for Q2 FY27 stood at ₹14,007 million, marking an 18.5% year-on-year growth. The reported EBDAT was ₹5,194 million, showing a robust 50.1% YoY increase. The PAT for the quarter was ₹3,667 million, reflecting a 55.2% surge compared to the same period last year.
Client Engagement and Market Share
Angel One’s client engagement remained strong with the average daily orders reaching 5.8 million in September 2026. The company’s share in India’s demat accounts stood at 16.6%, and its retail equity derivatives turnover share increased to 22.1%, up 43 basis points year-on-year. The commodity turnover more than doubled, highlighting the diversified growth across different segments.
Looking Ahead
Mr. Ambarish Kenghe, Group CEO of Angel One, emphasized the company’s resilience and strategic investments. He noted, ‘With strong foundations, multiple growth engines, and a relentless focus on client outcomes, we are confident in our ability to create enduring value while contributing meaningfully to India’s financial future.’ Angel One continues to evolve into a broader financial services ecosystem, poised to deepen customer relationships across investing, borrowing, and wealth creation.
Source: NSE Corporate Announcement
Fundamental & Technical Analysis of Angel One Limited
Angel One Limited belongs to the Financial Services › Capital Markets sector. Here’s a quick read on where the business and the stock stand today.
Angel posts a 3.8% three-month gain, but softens in the last few weeks. The PEG stands at 36.78 — severely stretched. Any earnings miss could trigger a sharp de-rating. Revenue consistency is the one bright spot — zero dips in five years shows operational resilience. The stock gives back 3.9% in the last month despite a positive three-month run. As a result, the earlier momentum appears to be fading. The stock rises 3.8% in three months on 20.3% revenue growth. As a result, the market gives it more credit than the fundamentals strictly justify. Watch the next quarterly results. If growth accelerates, the move makes sense. If not, expect some gains to unwind. Check Fundamentals of Angel One Limited.
Capital Markets
Indian Energy Exchange Limited (IEX) Achieves 77.2 BU Electricity Traded Volume in H1 FY’27
Indian Energy Exchange Limited (IEX) reports 77.2 BU electricity traded volume, a 14.2% YOY growth in H1 FY’27.

Indian Energy Exchange Limited (IEX) has reported a significant achievement in the first half of fiscal year 2027, with a total electricity traded volume of 77.2 BU, marking a robust 14.2% year-on-year growth. This impressive performance highlights IEX’s continued leadership in India’s electricity market. The exchange achieved a volume of 32.5 BU in the Real-Time Market (RTM), reflecting a 16.5% increase compared to the same period last year.
Electricity Market Performance
In the second quarter of FY’27, IEX saw a traded volume of 39.7 BU, a 12.7% increase from the previous year. The Day-Ahead Market (DAM) registered a total volume of 14,855 MU, a marginal 2.2% year-on-year increase. The Real-Time Market (RTM) experienced a 10.5% growth, reaching 16,490 MU. Notably, the Day Ahead Contingency and Term-Ahead Market (TAM) saw a remarkable 101.5% year-on-year growth, trading 5,477 MU in Q2 FY’27.
September 2026 Highlights
In September 2026, IEX achieved a monthly electricity traded volume of 12.2 BU, an increase of 10.4% year-on-year. The RTM volume for the month was 5.3 BU, up by 10.6% compared to September 2025. The highest ever single-day volume of 315 MU was recorded in the RTM on September 26, 2026. This surge in trading activity is indicative of the strong power demand in the country.
As a result, the average market clearing price in the Day-Ahead Market increased by 46% to Rs 5.7/unit during Q2 FY’27, and in the Real-Time Market, it rose by 49% to Rs 5.2/unit. These price increases reflect the growing energy consumption and demand in India, which touched 502 BUs in Q2 FY’27, marking an 11.5% year-on-year growth.
Source: NSE Corporate Announcement
Fundamental & Technical Analysis of Indian Energy Exchange Limited
Indian Energy Exchange Limited belongs to the Financial Services › Capital Markets sector. Here’s a quick read on where the business and the stock stand today.
Indian falls 14.8% over three months and has not found a floor yet. D/E stands at 0.01 with a 3.77% dividend yield. Furthermore, the business records zero revenue dips and zero loss quarters in five years — a fortress balance sheet. Industry-leading margins of 66.2% reflect exceptional pricing power and operational efficiency. RSI stands at 24, well into oversold territory. Yet sellers still dominated on 20 of recent sessions versus 8 for buyers, so the pressure has not fully lifted. Revenue grows at 15.4% and profits at 17.2% CAGR. However, the stock falls 14.8% in three months and RSI hits 24. The fundamentals argue for patience. The price action argues for caution. Your time horizon decides which wins. Check Fundamentals of Indian Energy Exchange Limited.
Capital Markets
Sg Finserve Limited (sgfin) Announces Loan Book Growth of 98% Yoy for H1-fy27
SG Finserve Limited (SGFIN) reports a strong loan book growth of approximately INR 5,694 crores for H1-FY27, marking a 98% year-on-year increase.

SG Finserve Limited (SGFIN) has announced its impressive financial performance for the first half of FY27. The company closed H1-FY27 with a loan book of approximately INR 5,694 crores, marking a robust year-on-year growth of ~98%.
Strong Year-on-Year Growth
The significant growth in the loan book is a testament to SGFIN’s strong business momentum. Compared to the same period last year, the loan book has expanded by a remarkable 98%. This growth reflects the company’s ability to leverage its extensive network and technological capabilities to provide tailored financing solutions to corporate and MSME customers.
Quarter-on-Quarter Growth
Moreover, SGFIN has demonstrated impressive quarter-on-quarter growth, with a ~25% increase in the loan book from June 30, 2026, to September 30, 2026. This consistent growth highlights the company’s capacity to attract and retain a growing customer base.
As a result, SG Finserve Limited continues to reinforce its position as a reliable and strong financial institution, with an AA-/Stable/A1+ rating from CRISIL and AA(CE)/Stable/A1+ rating from ICRA. The company remains committed to delivering exceptional financial services through its digital first, supply chain-focused approach.
Source: NSE Corporate Announcement
Fundamental & Technical Analysis of SG Finserve Limited
SG Finserve Limited belongs to the Financial Services › Capital Markets sector. Here’s a quick read on where the business and the stock stand today.
SG falls 8.6% over three months and has not found a floor yet. The PEG of 0.25 is extremely low. Either the market misses the growth story, or there is a catch worth investigating. D/E of 1.37 is elevated. As a result, debt servicing will compress free cash flow in a high-rate environment. The stock holds at 70% of its 52-week range with RSI at 37. In other words, neither side has a clear edge right now. Revenue grows at 102.3% and profits at 90.7% CAGR, with D/E of 1.37. Meanwhile, the stock dips 8.6% in three months without any fundamental deterioration. Consequently, the stock quietly becomes cheaper relative to earnings power. For long-term investors, that is a feature. Check Fundamentals of SG Finserve Limited.
-

 Consumer Cyclical3 days ago
Lemon Tree Hotels Limited Expands in Uttar Pradesh with 26th Property
-
 Communication Services3 days ago
Gtpl Hathway Limited: Digital TV Subscriber Increase by 1.5 Mn Drives Revenue Growth
-
 TATAPOWER2 days ago
Tata Power Advances 2.8 GW+ Data Centre Opportunity Pipeline Across
-
 Industrials2 days ago
Sigma Advanced Systems Limited (sigmaadv) Partners with Munitions INDIA Limited for Advanced Artillery Technology
-
 Credit Services2 days ago
Hdb Financial Services Limited (hdbfs) Records Profit After Tax of ₹780 Crores for Q2fy27, a Growth of 34.2% Yoy
-
 Industrials2 days ago
Reliance Industrial Infrastructure Limited (riil) Reports Q2 Fy26-27 Results: Income Down, Profit Margins Narrow
-
 Industrials2 days ago
Ptc Industries Limited (NSE: Ptcil) Selected by Safran for Aerolloy Technologies’ Titanium Castings
-

 Industrials2 days ago
Mamata Machinery Limited (mamata) Wins APR Design® for Recyclability Recognition in the United States