
Credit Services
Tata Capital Limited (TATACAP) gains 6% intraday backed by Q1FY27 results
Tata Capital Limited (TATACAP) stock gains 6% intraday to ₹376.5, driven by Q1FY27 results showing AUM up 22% YoY and PAT surging 56%.

Tata Capital Limited (TATACAP) edged up from its support zone, gaining +6% to ₹376.5 on the NSE on 29 Jul 2026. This move was backed by the company’s Q1FY27 results, where assets under management (AUM) increased by 22% YoY to ₹2,90,502 crore and profit after tax (PAT) surged by 56% YoY to ₹1,547 crore. Tata Capital, a key player in the financial services sector under the Tata Group, saw its stock price rise despite the broader sector showing mixed momentum. This indicates that today’s move is more company-specific rather than a sector-wide trend.
Technical setup — trendlines & DMA
From a technical perspective, Tata Capital’s stock is currently approaching its 6-month support trendline, which ends at ₹375.17, just 0.35% below the current price. The resistance level is at ₹390.92, which is 3.83% above the current price. The stock is trading above both its 50-DMA of ₹336.9 and 200-DMA of ₹332.6, indicating a bullish trend. However, the stock is in the upper third of its 52-week range, suggesting that a significant portion of the potential upside may already be priced in.
Snapshot: ₹376.50 on 2026-07-29 (chart frozen at publication)
Fundamentals & business context
Fundamentally, Tata Capital’s PE of 30.2 appears elevated given its profit margin of 38.7% and a revenue CAGR of 35.2% over the past 5 years. This suggests that the market may be pricing in future growth expectations, though the absence of profit CAGR data raises questions about sustained profitability. With institutional ownership at 4.7%, the stock does not have a strong backing from institutional investors, which could indicate a cautious approach from the smart money. The recent NSE catalyst highlights strong financial performance, but the overall fundamental picture requires careful consideration.
Algorithmic scorecard
The algorithmic scorecard for Tata Capital reflects a technically strong but fundamentally weak profile. The strongest signals include excellent efficiency with a 37.8% profit margin, indicating robust profitability, and very low debt with a D/E ratio of 0.00, showcasing strong financial health. On the weaker side, the negligible dividend yield of 0% offers little income to investors, and the declining revenue and profit CAGRs over the past 5 years suggest potential challenges in sustaining growth. These contrasting signals highlight the need for a balanced approach when evaluating the stock.
Company outlook
Management’s outlook for Tata Capital is optimistic, with the company well-positioned to deliver on its guidance for FY ’28. The expected improvement in margins is attributed to an increased proportion of high-yield businesses. The strong order pipeline, with disbursements crossing ₹50,000 crores in Q4FY26, underscores the company’s robust demand. In terms of strategic plans, Tata Capital intends to continue investing in technology, data infrastructure, and distribution expansion. Additionally, the company plans to expand its branch network by 10 to 15% in FY27, aiming to enhance its market reach and customer service.
Get all details on TATACAP — P&L, peers, shareholding and more on TradeAlone.








CGCL
Capri Global Capital Limited (cgcl) 2qfy27 Results: PAT Rises 77% Yoy to All-time High
Capri Global Capital Limited (CGCL) reports 2QFY27 results with a 77% YoY PAT rise to Rs 4.18 crores, boosted by strong growth and improved profitability.

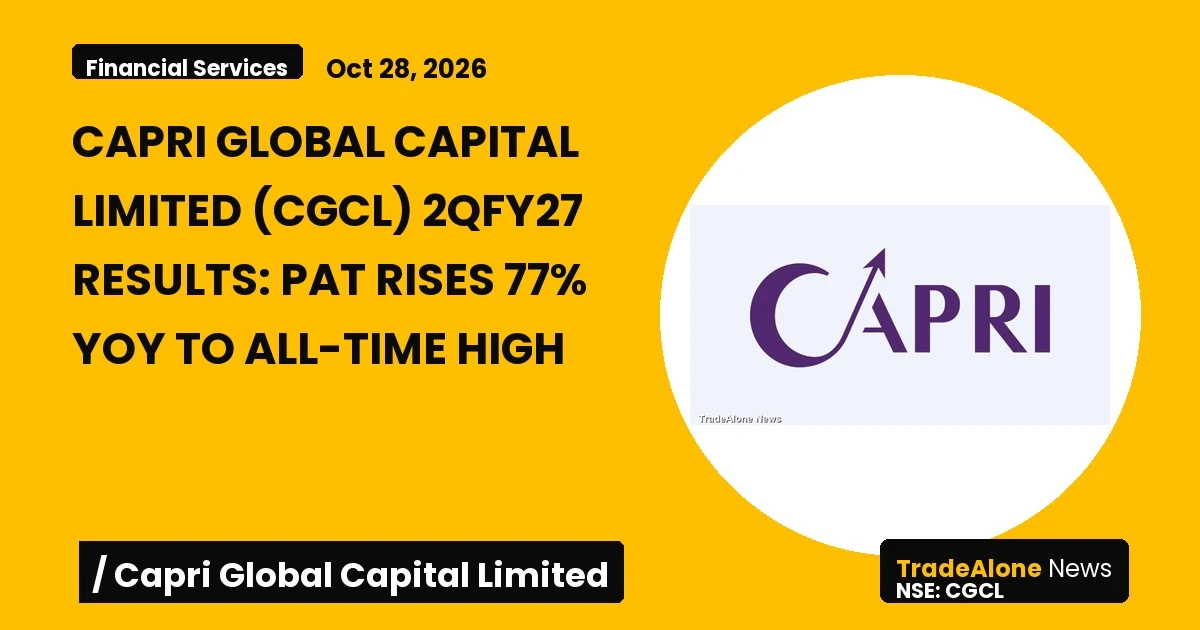
Capri Global Capital Limited (CGCL) announced its unaudited financial results for the quarter and half year ended Sep 30th, 2026, marking another strong quarter with consolidated AUM rising to Rs 43,878 crores, up 62% YoY. The company reported its highest-ever quarterly PAT of Rs 4.18 crores, an increase of 77% YoY, driven by robust portfolio growth, healthy lending spreads, and operating leverage.
Consolidated AUM Reaches Rs 43,878 Crores
CGCL’s consolidated AUM increased 62% YoY and 9% QoQ to Rs 43,878 crores. Growth was broad-based across its secured lending businesses, with significant contributions from Gold Loans, Construction Finance, Affordable Housing, and MSME Loans.
Profitability Scales to a New High
The company’s quarterly PAT increased 77% YoY to Rs 4.18 crores, supported by a 69% YoY rise in net interest income to Rs 812 crores and an 84% YoY increase in operating profit to Rs 636 crores. The yield on net advances remained at 17.5%, and the cost of borrowings stood at 9.2%, resulting in a spread of 8.3%.
Sustained Earnings Momentum
For 1HFY27, CGCL reported net interest income of Rs 1,549 crores, up 74% YoY, and non-interest income of Rs 487 crores, up 31% YoY. Operating profit grew 78% YoY to Rs 1,168 crores, while PAT increased 88% YoY to Rs 7.72 crores. The cost-to-income ratio improved to 42.6% from 48.1% in 1HFY26, reflecting stronger operating leverage.
Source: NSE Corporate Announcement
Fundamental & Technical Analysis of Capri Global Capital Limited
Capri Global Capital Limited belongs to the Financial Services › Credit Services sector. Here’s a quick read on where the business and the stock stand today.
Capri gains 38.0% over three months and trades near its 52-week highs. The PEG of 0.34 is extremely low. Either the market misses the growth story, or there is a catch worth investigating. D/E reaches 3.62. High leverage in this environment is a material risk the market cannot ignore. The stock trades at 96% of its 52-week range — near its best levels of the year. Clearly, the market pays a premium for this name. Both the business and the stock move in the right direction. Revenue grows at 48.6%, profits at 66.8%, and the PEG sits at 0.34 — below its growth rate. That combination is rare. Check Fundamentals of Capri Global Capital Limited.
Credit Services
Satin Creditcare Network Limited (satin) Reports Consolidated PAT of ₹299 Crores in H1fy27
Satin Creditcare Network Limited (SATIN) reports a consolidated PAT of ₹299 crores in H1 FY27, nearing ₹332 crore full-year profit.


Satin Creditcare Network Limited (SATIN) has announced its financial results for the Half Year ended 30th September 2026. The company reported a consolidated Profit After Tax (PAT) of ₹299 crores in H1 FY27, nearing the full-year profit of ₹332 crores for FY26 in just six months.
Financial Highlights
The company’s Assets under Management (AUM) grew by 31% to ₹16,589 crores in H1 FY27 compared to ₹12,687 crores in H1 FY26. Disbursement surged by 48% to ₹7,192 crores in H1 FY27 from ₹4,868 crores in H1 FY26. Total revenue increased by 27% to ₹1,760 crores in H1 FY27 from ₹1,391 crores in H1 FY26. Pre-Provision Operating Profit (PPOP) rose by 43% to ₹592 crores in H1 FY27 from ₹413 crores in H1 FY26.
Profitability
The company’s PAT for H1 FY27 was ₹299 crores, a significant 204% increase from ₹98 crores in H1 FY26. In Q2 FY27, PAT reached ₹176 crores, up 231% from ₹53 crores in Q2 FY26. Return on Assets (ROA) and Return on Equity (ROE) also saw substantial growth, with ROA increasing by 267 basis points to 4.4% and ROE rising by 1,386 basis points to 22.2% in H1 FY27.
Future Outlook
Dr. HP Singh, Chairman cum Managing Director of Satin Creditcare Network Limited, emphasized the company’s commitment to sustainable growth, balance sheet strength, and disciplined credit execution. With a strong capital base and diversified lending portfolio, SATIN is well-positioned to continue its growth trajectory.
Source: NSE Corporate Announcement
Fundamental & Technical Analysis of Satin Creditcare Network Limited
Satin Creditcare Network Limited belongs to the Financial Services › Credit Services sector. Here’s a quick read on where the business and the stock stand today.
Satin falls 9.3% over three months and has not found a floor yet. The PEG of 0.02 is extremely low. Either the market misses the growth story, or there is a catch worth investigating. D/E reaches 3.46. High leverage in this environment is a material risk the market cannot ignore. The stock gains 6.1% in the last month, recovering from the three-month slide. However, it is too early to call this a confirmed reversal. The stock rises -9.3% in three months on 23.5% revenue growth. As a result, the market gives it more credit than the fundamentals strictly justify. Watch the next quarterly results. If growth accelerates, the move makes sense. If not, expect some gains to unwind. Check Fundamentals of Satin Creditcare Network Limited.
Credit Services
Mas Financial Services Limited (masfin) Reports Q2 FY27: AUM Up 23%, PAT Rises 26%
MAS Financial Services Limited (MASFIN) reports Q2 FY27 results with a 23% increase in AUM and a 26% rise in PAT.


MAS Financial Services Limited (MASFIN) showcased a robust financial performance for the quarter ended 30th September 2026, reporting a consolidated Assets Under Management (AUM) of ₹17,042.86 Crores and Profit After Tax (PAT) of ₹115.12 Crores. This marks a significant growth of 23% in AUM and 26% in PAT compared to the corresponding quarter of the previous year, demonstrating the company’s strong fundamentals and commitment to excellence.
Consolidated Performance
The consolidated AUM for the quarter stands at ₹17,042.86 Crores, a notable increase from ₹12,999.14 Crores in the same quarter last year. The consolidated PAT also rose to ₹115.12 Crores from ₹91.43 Crores, reflecting the company’s efficient risk management and profitability strategies. The consolidated disbursement during the quarter was ₹4,907.95 Crores, highlighting the company’s active role in MSME financing.
Standalone Performance
MAS Financial Services Limited (Standalone) reported an AUM of ₹16,011.38 Crores and PAT of ₹110.05 Crores for the quarter ended 30th September 2026. This represents a 23% increase in AUM and a 23% rise in PAT compared to the same quarter last year. The standalone disbursement was ₹4,812.05 Crores, underscoring the company’s consistent financial health and growth trajectory.
Commenting on the performance, Mr. Kamlesh Gandhi, Founder, Chairman & Managing Director of MAS Financial Services Limited, said, ‘Team MAS has once again demonstrated a very robust performance, signifying high-quality growth for this quarter too. More than 23% growth in AUM and 25% in PAT on a consolidated basis bears the testimony to the same, we remain committed to grow between 23-25% prioritizing risk management and profitability.’ Team MAS remains committed to its mission of ‘Excellence through endeavors’ which we now reckon as ‘PURPOSE LED PROGRESS DRIVEN’.
Source: NSE Corporate Announcement
Fundamental & Technical Analysis of MAS Financial Services Limited
MAS Financial Services Limited belongs to the Financial Services › Credit Services sector. Here’s a quick read on where the business and the stock stand today.
MAS drops 15.4% over three months and trades near its 52-week lows. The PEG of 0.55 signals undervaluation relative to growth. It is a potential re-rating candidate. D/E reaches 3.46. High leverage in this environment is a material risk the market cannot ignore. The stock sits at 5% of its 52-week range, close to annual lows. Historically, value investors build positions at these levels — though cheap stocks can stay cheap. Revenue grows at 25.5% and profits at 22.2% CAGR, with D/E of 3.46. Meanwhile, the stock dips 15.4% in three months without any fundamental deterioration. Consequently, the stock quietly becomes cheaper relative to earnings power. For long-term investors, that is a feature. Check Fundamentals of MAS Financial Services Limited.
-

 COFORGE2 days ago
Coforge Limited (NSE: Coforge) Named Leader in Everest Group QE Services for AI Applications and Systems PEAK Matrix® Assessment 2026
-

 Consumer Defensive2 days ago
Lt Foods Limited Launches Campaign for Rozana with Celebrity Chef Ranveer Brar
-

 Conglomerates2 days ago
Dcm Shriram Limited (dcmshriram) Q2 FY27: 22% Revenue Growth at ₹3,977 Crore
-
 Healthcare2 days ago
Sakar Healthcare Limited (sakar): Delivers a Strong Quarter, with Revenue Growth of 53% and Ebitda Growth of 114% Yoy
-

 Basic Materials2 days ago
Chemcon Speciality Chemicals Limited Q2 FY27: Revenue Up 22%, PAT Surges 31%
-

 Healthcare2 days ago
Sudeep Pharma Limited (sudeepphrm) FDA Approval Enables New Pharma Greenfield Facility Operations
-

 RAYMONDREL2 days ago
Raymond Realty Limited (raymondrel) Secures ₹210 Crore Investment for Ten X Realty West
-

 BRIGHOTEL2 days ago
Brigade Hotel Ventures Limited (brighotel) Q2 FY27: PAT More Than Doubles