
Conglomerates
Cyient Limited (CYIENT) falls 5% intraday to ₹860.8
Cyient Limited (NSE: CYIENT) drops 5% intraday to ₹860.8, signaling a breakdown in trendline status and nearing support at ₹850.

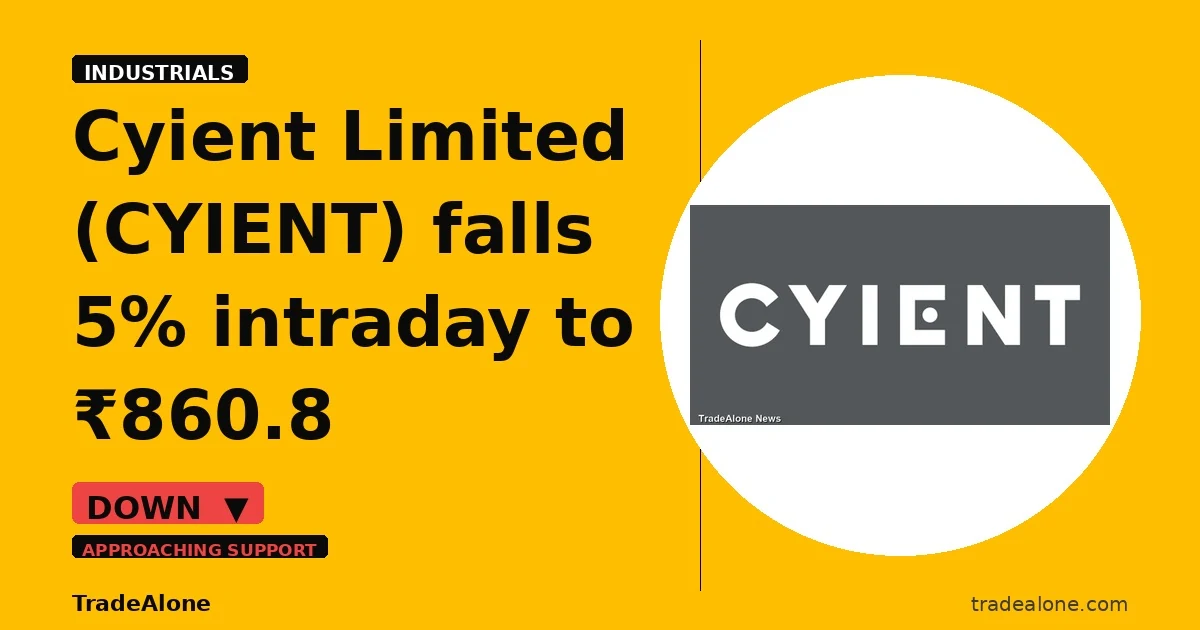
Cyient Limited (CYIENT) experienced a -5% drop to ₹860.8 on the NSE on 17 Jun 2026, primarily driven by the shift in trendline status from approaching resistance to approaching support. This move is somewhat isolated to Cyient within the industrials sector, as the broader conglomerate space has shown mixed momentum. The decline aligns with the stock nearing its 6M support trendline and testing the 50-DMA, indicating a critical juncture for momentum.
Technical setup — trendlines & DMA
From a technical standpoint, Cyient is currently navigating a delicate position. The 6M support trendline is situated at ₹850.19, just 1.23% below the current price, suggesting that the stock is precariously close to a potential support breach. Resistance is noted at ₹898.41, which is 4.37% above the current price, indicating that the stock has some room to climb before facing significant overhead pressure. The 50-DMA at ₹897.2 is slightly above the current price, while the 200-DMA at ₹1041.0 remains well above, signaling a bearish longer-term trend. The stock is currently in the lower third of its 52-week range, which implies that a substantial portion of its downward move may already be priced in, though the proximity to support suggests caution.
Snapshot: ₹860.80 on 2026-06-17 (chart frozen at publication)
Fundamentals & business context
On the fundamental front, Cyient’s PE of 23.5 appears elevated given its profit margin of 5.9% and a revenue CAGR of 6.5%. This suggests that the market may be pricing in some optimism about a potential turnaround, despite the current profit margin being relatively thin. The 48.4% institutional ownership indicates a level of confidence from sophisticated investors, though the recent decline in stock price may reflect concerns about the company’s near-term prospects. There was no specific NSE catalyst today, but the overall market sentiment and technical setup likely contributed to the move.
Algorithmic scorecard
The algorithmic scorecard for Cyient reflects a technically strong but fundamentally weaker profile. The strongest signals include the breakout above resistance levels with momentum and the bullish sentiment over the last 30 days, where up days saw nearly double the volume of down days. These indicators suggest that despite the recent decline, there is underlying accumulation and positive sentiment among active traders. However, the weakest signals are the declining profit CAGR of -6.0% and the low profit margin of 5.9%, which highlight the company’s challenges in maintaining profitability and growth. These factors represent significant risks, particularly in a competitive industrials sector where margins and growth are critical.
Company outlook
Management’s recent outlook indicates that Cyient is in the process of integrating a significant acquisition, which is expected to be completed within about 1.5 years. This acquisition will be primarily funded through debt, suggesting a strategic move to expand capabilities or market presence. The integration timeline and funding method highlight Cyient’s commitment to this growth initiative, though the impact on immediate financials and stock performance will depend on the successful execution of this plan.
Get all details on CYIENT — P&L, peers, shareholding and more on TradeAlone.





Conglomerates
Cyient Limited (cyient) Unveils New Brand Positioning ‘nothing Less’
Cyient Limited (CYIENT) unveils new brand positioning ‘Nothing Less,’ establishing itself as a Global Lifecycle Engineering Services leader.

Cyient Limited (CYIENT) today unveiled its new brand positioning and promise, ‘Nothing Less,’ reflecting its evolution as a Global Lifecycle Engineering Services leader and its commitment to helping customers achieve exemplary outcomes in an increasingly complex, intelligence-driven world.
New Positioning Establishes Company’s Addressable Market
The refreshed positioning brings intelligent engineering to every stage of the lifecycle, combining deep engineering expertise, domain knowledge, human intelligence, and AI applied in context. The new positioning will be the focal point of Cyient’s go-to-market strategy, representing an engineering portfolio that partners with customers across the full life cycle of their products and the assets that power their businesses, creating value measured over decades rather than projects.
Intelligent Engineering and Embracing Intelligence
The new brand reflects both the company’s capability and ways of working. Intelligent Engineering defines what we do: bringing together engineering, digital, and industry expertise to help customers improve performance, reliability, and growth. Embracing Intelligence defines how we do it: harnessing the combined power of people, data, and AI to unlock better decisions and better outcomes. Together, they reinforce Cyient’s focus on delivering exemplary outcomes.
Source: NSE Corporate Announcement
Fundamental & Technical Analysis of Cyient Limited
Cyient Limited belongs to the Industrials › Conglomerates sector. Here’s a quick read on where the business and the stock stand today.
Cyient trades in the lower quarter of its 52-week range. D/E of 0.09 and a 3.64% dividend yield give the balance sheet a decent cushion. Thin margins at 5.0% leave limited room for error — any demand softness or cost spike hits the bottom line hard. The stock gains 3.3% in the last month, recovering from the three-month slide. However, it is too early to call this a confirmed reversal. Revenue grows at 6.5% and the stock moves sideways over three months. Neither side makes a strong case. The next earnings print will likely break this stock out of its current range. Check Fundamentals of Cyient Limited.
Conglomerates
Godrej Industries Limited (godrejind) Signs Mou with Haryana for ₹20,000 Crore Investment
Godrej Industries Limited (GODREJIND) announces a ₹20,000 crore investment in Haryana, potentially creating 40,000 jobs.

Godrej Industries Limited (GODREJIND) has signed a Memorandum of Understanding (MoU) with the Government of Haryana, outlining a future investment plan of approximately ₹20,000 crore in the state, with the potential to create around 40,000 jobs. The MoU reflects the Group’s growing presence in Haryana and its confidence in the state’s long-term economic potential. The proposed investments will build on the Group’s existing footprint in the state.
Existing Investments
Godrej Industries Group has invested approximately ₹12,000 crore in Haryana to date and employs around 9,000 people across its businesses. Godrej Properties Ltd (GPL) will be a key driver of the Group’s investment plans. Having invested approximately ₹11,000 crore in Haryana to date, GPL plans to invest a further ₹16,000 crore by FY28.
Future Plans
Godrej Ventures, its real estate private equity business, has invested around ₹1,000 crore in Haryana and plans to invest a further ₹3,500 crore in Grade A+ office infrastructure in Gurugram. Its proposed investments are expected to generate more than 30,000 direct and indirect jobs.
Community and Infrastructure Initiatives
Alongside its business investments, Godrej Industries Group has also contributed to community and infrastructure initiatives in Haryana. The Group spends approximately ₹1 crore annually on CSR initiatives and more than ₹10 crore on infrastructure-level initiatives in the state.
Pirojsha Godrej, Chairperson, Godrej Industries Group, said, “Haryana has emerged as an important growth driver for the Godrej Industries Group. We’re pleased to formalise this next phase of investment through our MoU with the Government of Haryana and look forward to working closely with the state to bring these plans to life.”
Source: NSE Corporate Announcement
Fundamental & Technical Analysis of Godrej Industries Limited
Godrej Industries Limited belongs to the Industrials › Conglomerates sector. Here’s a quick read on where the business and the stock stand today.
Godrej posts a 10.3% three-month gain, but softens in the last few weeks. The PEG stands at 4.05 — severely stretched. Any earnings miss could trigger a sharp de-rating. D/E of 1.78 is elevated. As a result, debt servicing will compress free cash flow in a high-rate environment. The stock gives back 9.2% in the last month despite a positive three-month run. As a result, the earlier momentum appears to be fading. The stock holds up despite 9.8% revenue growth and a PEG of 4.05. That could signal an early turnaround. Alternatively, index flows simply support the price. Watch whether analysts revise estimates upward — that is the real signal. Check Fundamentals of Godrej Industries Limited.
Conglomerates
Sbc Exports Limited Q1 FY27: Revenue and Net Profit Surge Significantly
SBC Exports Limited (SBC) reports strong Q1 FY27 results with 67.11% YoY revenue growth and 269.23% net profit surge.

SBC Exports Limited announced its financial results for Q1 FY27 (Quarter ended on 30 June 2026) on 12th August, 2026. The company delivered a strong performance with year-on-year revenue growth of 67.11% and net profit growth of 269.23%. This impressive performance was driven by robust execution in its garments export business, IT support services, and travel verticals.
Key Financial Highlights
The company’s revenue surged by 72.80% to ₹121.08 crore. EBITDA surged by 192.21% to approximately ₹16.89 crore. The EBITDA margin increased from 8.02% to 13.64%. The PAT surged by 269.23% to ₹9.60 crore, with the PAT margin improving from 3.60% to 7.93%.
Management Commentary
Commenting on the company’s performance, Mr. Govind Ji Gupta, Managing Director, said: “We are pleased to have commenced the financial year on a strong note, with healthy business growth and improved operating performance. The quarter reflects strengthening demand, expansion of our customer base, increased business opportunities, and our continued focus on operational efficiency.”
He added, “Based on the current business momentum, emerging opportunities, and our ongoing growth initiatives, we are targeting overall business growth of approximately 40%–50% for FY 2026–27, subject to prevailing market conditions and successful execution of our business plans.”
The company intends to use the restored shipping connectivity as a growth catalyst, with a focused strategy to rebuild export volumes, strengthen relationships with existing customers, and expand its presence across the Middle East and other international markets.
Source: NSE Corporate Announcement
Fundamental & Technical Analysis of SBC Exports Limited
SBC Exports Limited belongs to the Industrials › Conglomerates sector. Here’s a quick read on where the business and the stock stand today.
SBC gains 20.1% over three months and trades near its 52-week highs. D/E reaches 2.45. High leverage in this environment is a material risk the market cannot ignore. Thin margins at 6.3% leave limited room for error — any demand softness or cost spike hits the bottom line hard. The stock gives back 4.7% in the last month despite a positive three-month run. As a result, the earlier momentum appears to be fading. Revenue grows at 27.2% and the stock moves sideways over three months. Neither side makes a strong case. The next earnings print will likely break this stock out of its current range. Check Fundamentals of SBC Exports Limited.
-

 CUMMINSIND2 days ago
Cummins India Limited (cumminsind) Unveils Next-generation Power Solutions at Bauma Conexpo India 2026
-

 Industrials2 days ago
Western Carriers (india) Limited Launches Bulk Tiles Train at Morbi Terminal
-
 CARTRADE2 days ago
Cartrade Tech Limited (cartrade) Expands OLX India’s Elite Buyer for Businesses
-

 Auto Parts2 days ago
Uno Minda Limited Announces Four Major Strategic Expansions with ₹1,415 Crore Investment
-
 AUROPHARMA2 days ago
Aurobindo Pharma Limited Receives Final Approval for Beclomethasone Dipropionate HFA Inhalation Aerosol
-
 RATEGAIN2 days ago
Rategain Travel Technologies Limited Unveils Key Findings from the State of Distribution 2026 Report
-

 Credit Services2 days ago
Muthoot Microfin Limited (muthootmf) Secures ₹250 Crore Through Ncds to Drive Growth Plans
-
 Auto Parts2 days ago
Schaeffler India Limited (schaeffler) Unveils Next-generation Motion Technology Solutions at Bauma Conexpo INDIA 2026