
OPTIEMUS
Optiemus Infracom Limited Expands Partnership with CMF to Build India’s First Full-stack R&D Smartphone Capability
Optiemus Infracom Limited (OPTIEMUS) expands partnership with CMF to build India’s first full-stack R&D smartphone capability, laying groundwork for majority.

Optiemus Infracom Limited (OPTIEMUS) has announced an expanded partnership with CMF, a global consumer technology brand, to build India’s first end-to-end R&D smartphone capability. This strategic move will lay the groundwork for India’s first full-stack smartphone R&D capability and result in majority Indian shareholding. The partnership, which includes Optiemus joining Nothing’s upcoming Series A investment round for the CMF brand, is designed to create a comprehensive manufacturing, ownership, and R&D alliance under a single Indian entity.
Building India’s First Full-Stack Smartphone R&D Capability
The expanded partnership aims to develop CMF into India’s first smartphone brand with full-stack, end-to-end R&D capabilities, developed across six core disciplines: Industrial Design, Mechanical Engineering, Camera Engineering, Software Engineering, Connectivity Engineering, and Component Engineering. This initiative builds on Nothing’s proven experience in developing products in-house and aims to create a demand-driven ecosystem in India, where engineering talent, component suppliers, local IP, and product development can scale and drive innovation together.
About CMF and Optiemus
CMF is a smartphone and consumer technology brand founded by Nothing in 2023. Sold in more than 40 countries, CMF has quickly established itself as a global name and is making India the center of its next chapter. Optiemus Infracom Limited is engaged in the business of electronics manufacturing in India, providing end-to-end solutions to global and Indian brands. The company operates six integrated business verticals and has five state-of-the-art manufacturing units across India.
As a result of this partnership, CMF will leverage Optiemus’s manufacturing expertise to build India’s first full-stack smartphone R&D capability, designed and engineered in India, for the world.
Source: NSE Corporate Announcement
Fundamental & Technical Analysis of Optiemus Infracom Limited
Optiemus Infracom Limited belongs to the Technology › Electronics & Computer Distribution sector. Here’s a quick read on where the business and the stock stand today.
Optiemus gains 30.1% over three months and trades near its 52-week highs. The PEG stands at 4.46 — severely stretched. Any earnings miss could trigger a sharp de-rating. Razor-thin margins below 5% make profitability extremely vulnerable — this business needs scale or pricing power urgently. The stock trades at 71% of its 52-week range — near its best levels of the year. Clearly, the market pays a premium for this name. The stock rises 30.1% in three months on 15.4% revenue growth. As a result, the market gives it more credit than the fundamentals strictly justify. Watch the next quarterly results. If growth accelerates, the move makes sense. If not, expect some gains to unwind. Check Fundamentals of Optiemus Infracom Limited.









Electronics and Computer Distribution
Optiemus Infracom Limited (OPTIEMUS) shows pressure after breakout, falls 5% intraday
Optiemus Infracom Limited (NSE: OPTIEMUS) falls 5% intraday to ₹593.0, showing pressure after breakout.

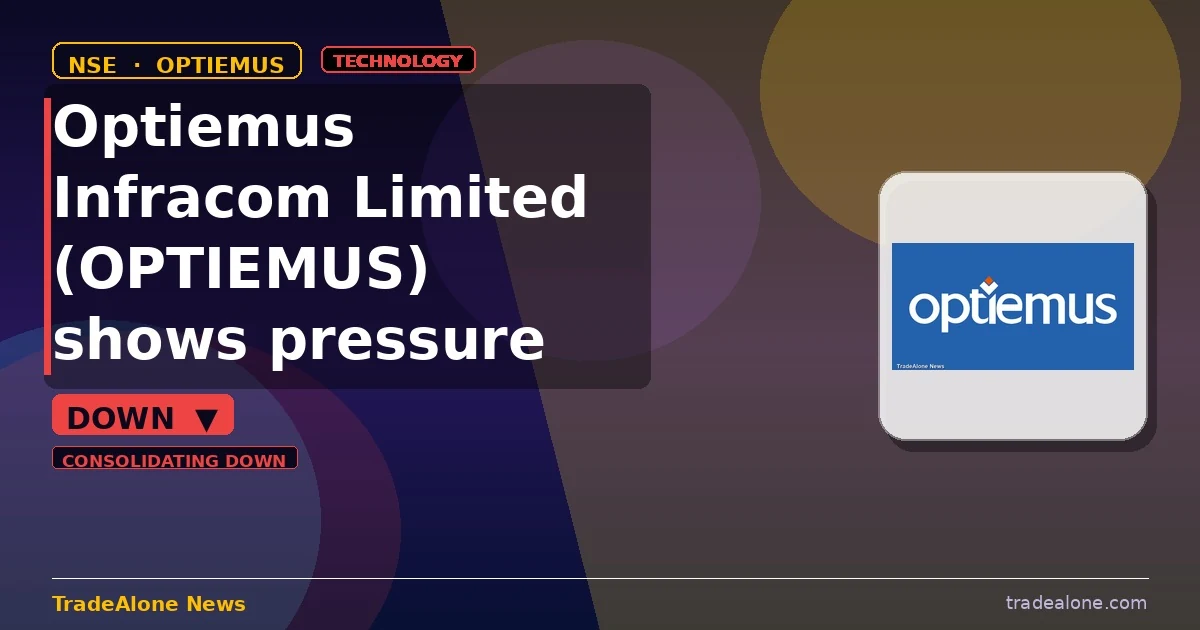
Optiemus Infracom Limited (OPTIEMUS) fell -5% today, shifting from a breakout to consolidating down. This move comes after the company reported a ₹500 crore revenue increase in Q1 FY27, backed by its strategic growth blueprint. In the technology sector, specifically electronics and computer distribution, Optiemus has been a notable player. Today’s pullback, however, seems to be more company-specific rather than a sector-wide phenomenon.
Technical setup — trendlines & DMA
Currently, the 6-month support trendline stands at ₹403.71, which is 31.92% below today’s price, indicating a solid floor. Resistance is at ₹641.44, 8.17% above the current price. The 50-DMA at ₹499.8 is above the 200-DMA at ₹462.2, signaling a bullish trend. However, the stock is 25% above the 50-DMA, suggesting it might be overextended. In its 52-week range, the stock is in the upper third, 72% up from the 52-week low and -16.8% from the high, indicating that a significant portion of the move is already priced in.
Snapshot: ₹593.00 on 2026-08-05 (chart frozen at publication)
Fundamentals & business context
With a PE of 84.5 and profit margins at 3.7%, Optiemus Infracom’s valuation appears stretched relative to its current earnings. The revenue CAGR of 15.7% and profit CAGR of 16.4% show solid growth, but the thin margins and high PE ratio suggest that the market might be pricing in future growth aggressively. Institutional ownership is low at 1.2%, indicating that institutional investors are not heavily invested in this name. There is no NSE catalyst today, so the move is likely driven by technical factors and market sentiment.
Algorithmic scorecard
The overall scorecard reflects a technically strong but fundamentally weak position. The strongest signals are the bullish trend, with the 50-DMA above the 200-DMA, and the strong momentum across all timeframes, indicating positive price growth. However, the weakest signals are the low profit margin of 3.7%, which leaves little room for error, and the overvalued PEG of 5.15, suggesting the stock is expensive relative to its growth rate. These factors highlight the risks associated with the current valuation.
Company outlook
Optiemus Infracom has outlined a robust forward guidance, with a ₹500 crore revenue increase in Q1 FY27. The company’s strategic growth blueprint includes key initiatives such as the AI+ EMS partnership and the MPMS/PLI 2.0 framework, which are expected to strengthen its position in domestic mobile manufacturing. The growth drivers include the AI+ EMS partnership and the BIS compliance for screen protectors, expected within the next 30 days. Management has also highlighted the second B2C category launch as a key growth area. These initiatives aim to enhance revenue and market position in the coming quarters.
Get all details on OPTIEMUS — P&L, peers, shareholding and more on TradeAlone.
OPTIEMUS
Optiemus Infracom Limited (optiemus) Q1 FY27: Revenue Up ₹500 Cr, Strategic Growth Blueprint Unveiled
Optiemus Infracom Limited (OPTIEMUS) Q1 FY27 results show ₹500 cr revenue from AI+ EMS partnership, strategic growth blueprint unveiled.

Optiemus Infracom Limited (OPTIEMUS) has reported a significant ₹500 crore revenue in Q1 FY27, driven by its AI+ EMS partnership. The company’s disciplined execution in Q1 FY27 has driven performance ahead of guidance, with the MPMS/PLI 2.0 framework expected to strengthen its position in domestic mobile manufacturing. Beyond EMS, key catalysts are aligning rapidly, including the announcement for BIS compliance for screen protectors expected within the next 30 days. The second B2C category launch is scheduled for Q3 FY27, which should scale B2C revenue and improve overall margins. The high-barrier B2B cover glass business is expected to begin onboarding customers over the next 3–4 quarters. With strong order visibility, we expect FY27 revenue to double. The company then aims to sustain annual revenue growth of over 30% in FY28 and FY29. These projections exclude contributions from the screen protector, cover glass segment, and the upcoming Q3 FY27 B2C launch, providing upside to the outlook.
Optiemus’s Strategic Growth Blueprint
The company’s vision is to leverage deep distribution expertise and world-class EMS capabilities to build a proprietary B2C product portfolio. The B2C pivot includes a high-growth consumer category, expected to launch in Q3 FY27. The cover glass joint venture with Corning International is on track, with OEM audits underway and customer onboarding likely in Q4 FY27/Q1 FY28. Drones offer medium-term option value through defence and precision-agriculture platforms. The EMS scale-up has generated over ₹500 crore in revenue, with Unit 3 coming online in Q1 FY27. The company aims to achieve a ₹6,000 crore revenue target by FY29.
Financial Outlook
The baseline guidance anticipates a doubling of revenue in FY27, backed by annual growth of 30%+ in FY28 and FY29. This outlook does not include potential revenue from the screen protector, cover glass business, and the upcoming Q3 FY27 B2C category launch. The company’s strategic growth blueprint and disciplined execution are set to drive robust financial performance in the coming years.
Source: NSE Corporate Announcement
Fundamental & Technical Analysis of Optiemus Infracom Limited
Optiemus Infracom Limited belongs to the Technology › Electronics & Computer Distribution sector. Here’s a quick read on where the business and the stock stand today.
Optiemus gains 39.7% over three months and trades near its 52-week highs. The PEG stands at 5.15 — severely stretched. Any earnings miss could trigger a sharp de-rating. Razor-thin margins below 5% make profitability extremely vulnerable — this business needs scale or pricing power urgently. Buyers show up with 2.1x the volume of sellers. Moreover, they dominated on 20 of recent sessions versus 10 for sellers — a healthy accumulation pattern. The stock rises 39.7% in three months on 15.7% revenue growth. As a result, the market gives it more credit than the fundamentals strictly justify. Watch the next quarterly results. If growth accelerates, the move makes sense. If not, expect some gains to unwind. Check Fundamentals of Optiemus Infracom Limited.
Electronics and Computer Distribution
Optiemus Infracom Limited (NSE: OPTIEMUS) breaks out, moves up 5%
Optiemus Infracom Limited (NSE: OPTIEMUS) clears its 6M resistance trendline, moving up 5% intraday to ₹571.2.

Optiemus Infracom Limited (OPTIEMUS) breaks out with a +5% gain to ₹571.2 on the NSE, clearing its 6M resistance trendline. This move is driven by strong technical momentum, as the stock has surpassed its key resistance level at ₹473, marking a 17.2% breakout. In the technology sector, specifically electronics and computer distribution, Optiemus Infracom’s breakout aligns with its robust revenue and profit growth over the past five years, although it stands out as a company-specific move rather than a sector-wide trend.
Technical setup — trendlines & DMA
The current trendline structure for Optiemus Infracom shows a solid 6M support floor at ₹391.35, which is 31.49% below today’s price, indicating a strong base. Resistance was previously at ₹473.21, but the stock has now broken above this level, signaling a bullish breakout. The 50-DMA at ₹441.9 is below the 200-DMA at ₹466.3, typically a bearish signal, but the stock’s current price is well above both moving averages, suggesting a strong upward momentum. Within its 52-week range of ₹288.0 to ₹713.0, the stock is currently in the middle third, indicating that while there is room for further upside, the stock is already trading at a premium relative to its 52-week low.
Snapshot: ₹571.20 on 2026-07-13 (chart frozen at publication)
Fundamentals & business context
With a PE ratio of 73.4 and profit margins at 3.7%, Optiemus Infracom’s valuation appears stretched relative to its current earnings, especially given its revenue CAGR of 15.7% and profit CAGR of 16.4% over the past five years. The market seems to be pricing in future growth potential, but the thin profit margins raise questions about sustainability. Institutional ownership is notably low at 1.4%, suggesting that larger investors are cautious about the stock. There is no NSE catalyst today, indicating that the move is purely technical.
Algorithmic scorecard
The algorithmic scorecard reflects a technically strong but fundamentally weak profile for Optiemus Infracom. The strongest signals include the breakout above resistance levels with significant momentum, as evidenced by the stock’s 28.2% gain over the past month and 43.2% over three months. Additionally, the bullish sentiment over the last 30 days, with a volume ratio of 2.48x on up days compared to down days, points to systematic accumulation. On the weaker side, the low profit margin of 3.7% leaves little room for error, and the PEG ratio of 4.48 indicates the stock is overvalued relative to its growth rate. These factors highlight the risks associated with the stock’s current valuation and momentum.
Get all details on OPTIEMUS — P&L, peers, shareholding and more on TradeAlone.
-

 GAIL3 days ago
Gail (india) Limited Appoints Shri Manoj Kumar Sharma as Director (projects)
-

 Basic Materials3 days ago
Steel Authority of India Limited (sail) FY’27 Snapshot: Robust Financials and Production Metrics
-

 COFORGE2 days ago
Coforge Limited (NSE: Coforge) Expands Ai-powered Vehicle Lifecycle Intelligence Capabilities
-

 Apparel Manufacturing1 day ago
Iris Clothings Limited (irisdoreme) Expands Doreme’s Digital Footprint Through Amazon Partnership
-

 Information Technology Services1 day ago
Magellanic Cloud Limited (NSE: Mcloud) Enters AI Smart Fuel Infrastructure Market with Nayara Energy Contract
-

 PREMIERENE1 day ago
Premier Energies Limited (premierene) Commissions India’s Largest Solar Cell Facility
-

 DBL23 hours ago
Dilip Buildcon Limited (DBL) Sells Stake in Under-construction Solar Portfolio to Alpha Alternatives
-
 BIOCON1 day ago
Biocon Limited (biocon) Pertuzumab Becomes First Biosimilar to Secure EMA CHMP Approval