
Information Technology Services
Zensar Technologies Limited (ZENSARTECH) breaks out, moves up 6% intraday
Zensar Technologies Limited (NSE: ZENSARTECH) stock breaks out, moving up 6% intraday, clearing its 6M resistance trendline. Current price: ₹539.4.

Zensar Technologies Limited (ZENSARTECH) breaks out, gaining +6% to ₹539.4 on the NSE on 13 Jul 2026. The stock cleared its 6M resistance trendline, which was previously approaching resistance. This move places Zensar in a favorable position within the technology sector, particularly in information technology services, where breakouts can signal renewed investor confidence and potential for further upside.
Technical setup — trendlines & DMA
From a technical standpoint, Zensar’s current price is well above its 6M support trendline, which ends at ₹395.8, indicating a robust floor. The stock has decisively broken above the 6M resistance trendline at ₹450.05, signaling a breakout. The 50-DMA at ₹478.7 is below the 200-DMA at ₹616.8, typically a bearish signal, but the breakout suggests a potential shift in momentum. Zensar’s current price is in the lower third of its 52W range, suggesting there may be room for further upward movement as the stock recovers from its 52W lows.
Snapshot: ₹539.40 on 2026-07-13 (chart frozen at publication)
Fundamentals & business context
Fundamentally, Zensar’s PE of 15.1, coupled with a profit margin of 7.3% and a revenue CAGR of 5.5%, suggests the market may be pricing in future growth rather than current earnings. The strong profit CAGR of 33.2% over 5 years indicates potential for margin expansion, which could justify the current valuation. Institutional ownership at 26.5% reflects a cautious but present interest from smart money, though no specific NSE catalyst drove today’s move.
Algorithmic scorecard
The overall scorecard reflects a balanced view, with strong technical signals offset by some fundamental weaknesses. The breakout with momentum, scoring perfectly in this category, indicates a positive shift in market sentiment. The undervalued PEG of 0.45 suggests the stock is cheap relative to its growth, offering potential upside. On the weaker side, the low profit margin of 7.3% leaves little room for error, and the stock’s position near yearly lows within its 52W range highlights the risk of limited price growth in the near term.
Company outlook
Management’s outlook for Zensar Technologies is cautiously optimistic. They expect no degrowth in Q1 FY ’27 and anticipate full-fledged revenue from a large deal to ramp up from Q3 FY ’27. Margins are projected to be in the mid-teens range for FY ’27, with potential blips due to growth initiatives. The company is targeting newer segments and shaping more large deals with significant AI components, alongside an infusion of AI in internal processes across HR, finance, and legal contracts. These strategic plans aim to drive future revenue and efficiency gains.
Get all details on ZENSARTECH — P&L, peers, shareholding and more on TradeAlone.







HCLTECH
Hcl Technologies Limited (hcltech) Q2 FY27: Revenue ₹35,620cr ↑3.0% Qoq ↑11.5% Yoy
HCL Technologies Limited (HCLTECH) announces Q2 FY27 results with revenue ₹35,620Cr, up 3.0% QoQ and 11.5% YoY, driven by advanced AI growth.

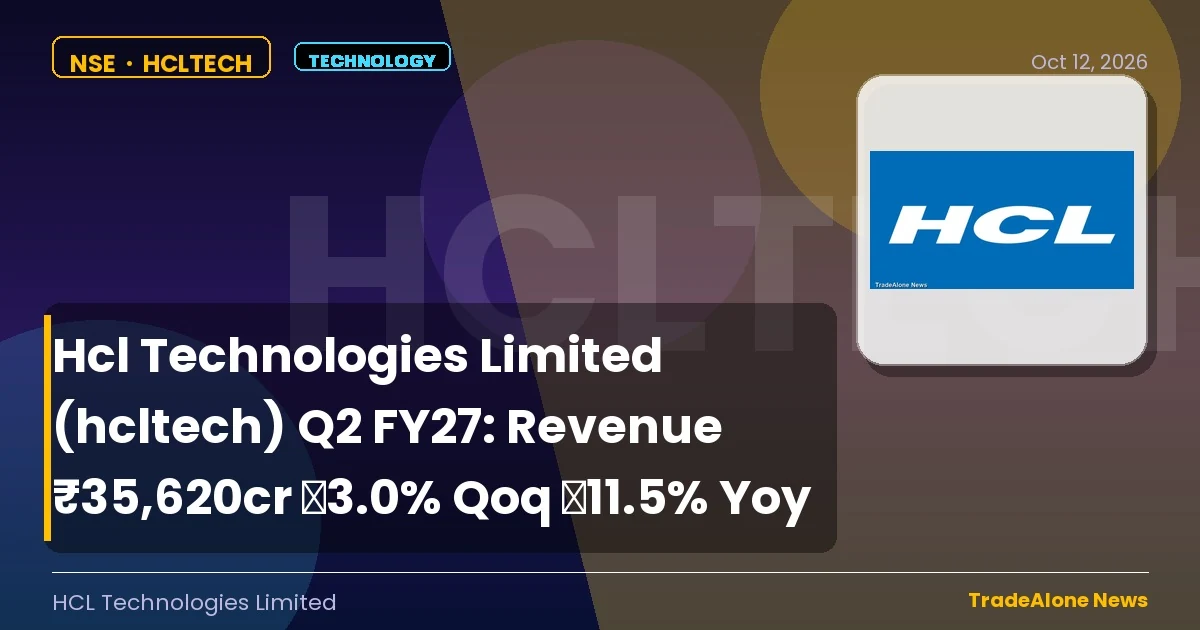
HCL Technologies Limited (NSE: HCLTECH) announced its Q2 FY27 results, showcasing a robust performance with revenue of ₹35,620 crores, marking a 3.0% increase QoQ and 11.5% YoY growth. The company’s superior revenue growth and improved profitability led to its highest-ever quarterly Net Income of INR 5,132 crores, up 11.0% QoQ and 21.2% YoY.
Advanced AI Revenue Surge
The accelerating growth in Advanced AI revenue, up 28.4% QoQ and 78.0% YoY in constant currency, validates HCLTech’s business strategy. The company’s AI propositions are resonating well with clients, giving confidence in its growth trajectory.
Financial Highlights
HCLTech’s EBIT margin expanded 131 bps QoQ to 18.2%, while the Services segment grew 3.0% QoQ with growth across verticals and geographies. The company’s focus on improving capital efficiency resulted in LTM ROIC of 41.2% for the company, up 261 bps YoY; and 49.4% for the Services business, up 411 bps YoY respectively.
As we look ahead, HCLTech remains well-positioned to drive growth and deliver value to our shareholders, with a strong pipeline of opportunities and a commitment to innovation and excellence.
Source: NSE Corporate Announcement
Fundamental & Technical Analysis of HCL Technologies Limited
HCL Technologies Limited belongs to the Technology › Information Technology Services sector. Here’s a quick read on where the business and the stock stand today.
HCL drops 19.6% over three months and trades near its 52-week lows. The PEG stands at 4.64 — severely stretched. Any earnings miss could trigger a sharp de-rating. D/E stands at 0.09 with a 7.86% dividend yield. Furthermore, the business records zero revenue dips and zero loss quarters in five years — a fortress balance sheet. The stock gains 5.2% in the last month, recovering from the three-month slide. However, it is too early to call this a confirmed reversal. Revenue grows at 8.7% and the stock moves sideways over three months. Neither side makes a strong case. The next earnings print will likely break this stock out of its current range. Check Fundamentals of HCL Technologies Limited.
Information Technology Services
L&t Technology Services Limited (ltts) Launches Ai-native EI Lab Featuring Nvidia Accelerated Factory
L&T Technology Services Limited (NSE: LTTS) launches its AI-Native EI Lab featuring advanced NVIDIA accelerated digital twins and AI-driven solutions.

L&T Technology Services Limited (NSE: LTTS) has inaugurated its AI-Native EI Lab for Digital Manufacturing in Bengaluru, showcasing cutting-edge Engineering Intelligence solutions. The lab, featuring advanced NVIDIA accelerated digital twins and AI-driven solutions, aims to transform manufacturing processes through autonomous systems and intelligent operations.
Showcasing AI-Native Manufacturing
The EI Lab highlights LTTS’ Engineering Intelligence solutions across autonomous manufacturing, industrial robotics, supply chain, energy & emissions, and asset reliability. It features NVIDIA accelerated digital twins, Industrial AI, and Physical AI for simulation, validation, and increasingly autonomous field operations.
NVIDIA Accelerated Digital Twins
The lab’s AI-Native Factory layer integrates intelligent machines, robots, cobots, drones, and autonomous systems with minimal human intervention. This is powered by an NVIDIA accelerated environment combining technologies like Omniverse, Isaac Sim, PhysX, Cosmos, NeMo, and OpenUSD-based digital twin workflows.
Future of Manufacturing
“AI is transforming how manufacturers design, simulate, and operate the factories of the future,” said Vishal Dhupar, Managing Director for South Asia at NVIDIA. “The EI Lab, combining NVIDIA technologies and LTTS’ deep engineering expertise, gives manufacturers a practical environment to explore and validate AI-driven, simulation-first approaches to industrial transformation.”
As a result, L&T Technology Services Limited is poised to lead in the realm of smart, AI-driven manufacturing solutions, driving innovation and efficiency across various industrial sectors.
Source: NSE Corporate Announcement
Fundamental & Technical Analysis of L&T Technology Services Limited
L&T Technology Services Limited belongs to the Technology › Information Technology Services sector. Here’s a quick read on where the business and the stock stand today.
L&T trades in the lower quarter of its 52-week range. The PEG stands at 14.78 — severely stretched. Any earnings miss could trigger a sharp de-rating. Revenue grows at 7.6% CAGR. The company generates cash but does not compound aggressively. The stock sits at 15% of its 52-week range, close to annual lows. Historically, value investors build positions at these levels — though cheap stocks can stay cheap. Revenue grows at 7.6% and the stock moves sideways over three months. Neither side makes a strong case. The next earnings print will likely break this stock out of its current range. Check Fundamentals of L&T Technology Services Limited.
Information Technology Services
Persistent Systems Limited Secures Strong Majority Stake Takeover Offer for Nagarro Ends Successfully
Persistent Systems Limited secures 94.04% of Nagarro share capital, exceeding minimum threshold; plans to squeeze out remaining minority shareholders.

Persistent Systems Limited (PERSISTENT) has successfully concluded its Voluntary Public Takeover Offer for all outstanding shares of Nagarro SE, securing approximately 94.04% of Nagarro’s share capital and voting rights, significantly surpassing the required minimum acceptance threshold of 50% plus one share.
Successful Takeover Offer
Galaxy Germany Holding SE, a wholly-owned direct subsidiary of Persistent Systems Limited, announced the final results of the offer following the expiry of the statutory additional acceptance period. During this period, an additional 1,335,114 Nagarro shares were tendered into the offer, bringing the total tendered shares to 8,903,259, representing approximately 71.94% of Nagarro’s share capital and voting rights. Combined with the 22.10% stake already secured by Persistent, the total secured stake is approximately 94.04%.
Next Steps and Future Plans
Sandeep Kalra, Chief Executive Officer and Executive Director of Persistent Systems Limited, stated, “The final results of our offer for Nagarro are a clear endorsement of the strategic logic behind bringing Persistent and Nagarro together. We now look forward to completing the remaining steps toward closing.” Persistent plans to initiate a squeeze-out of the remaining minority shareholders of Nagarro upon closing, although no final decision has been made yet.
Expected Transaction Closure
The transaction is anticipated to close by the end of Q1 CY27, pending only a limited number of outstanding regulatory approvals. Persistent will provide further details on the specific measures to be taken in due course. This strategic move aims to build a global AI-led digital engineering player, as envisioned by Persistent.
Source: NSE Corporate Announcement
Fundamental & Technical Analysis of Persistent Systems Limited
Persistent Systems Limited belongs to the Technology › Information Technology Services sector. Here’s a quick read on where the business and the stock stand today.
Persistent rises 14.2% over three months, with buying pressure holding steady. Revenue grows at 20.9% and profits at 26.5% CAGR. Both numbers are exceptional. Not a single revenue dip or loss quarter in five years — this is a business built to last through cycles. The stock holds at 65% of its 52-week range with RSI at 63. In other words, neither side has a clear edge right now. The business grows revenue at 20.9% and profits at 26.5%, with D/E of 0.05. The stock reflects that strength. Moreover, when fundamentals and price action align, the PEG of 1.78 premium is usually justified. Check Fundamentals of Persistent Systems Limited.
-
 Basic Materials3 days ago
Jindal Stainless Limited (JSL) Wins Three Sustainability Recognitions for Hisar Unit
-
 Industrials2 days ago
Krystal Integrated Services Limited (krystal) to Generate 10,000+ Jobs Across 25+ Cities
-

 Industrials2 days ago
Oswal Pumps Limited to Establish 1.2 GW Topcon Solar Cell Manufacturing Facility
-
 Real Estate2 days ago
Signatureglobal (india) Limited Reports Pre-sales of INR 18.3 Billion in Q2fy27
-
 Consumer Defensive2 days ago
Avenue Supermarts Limited Q2fy27: Standalone Total Revenue Up 18.4% at Rs.19,206 Crore
-

 Consumer Cyclical1 day ago
P N Gadgil Jewellers Limited PNGJL Inaugurates 81st Store in Ayodhya with Kangana Ranaut
-

 GODREJPROP1 day ago
Godrej Properties Limited (godrejprop) Inaugurates First Milestone of Bandra Bay Transformation
-

 DREAMFOLKS2 days ago
Dreamfolks Services Limited Launches Dreamfolks Club Nagavalli Wilderness Estate in the Eastern Ghats