
Auto Parts
Gabriel India Limited (NSE: GABRIEL) breaks out, gains 6% intraday
Gabriel India Limited (NSE: GABRIEL) stock breaks out with a 6% intraday gain, clearing its 6-month resistance trendline. Current price is ₹1489.2.

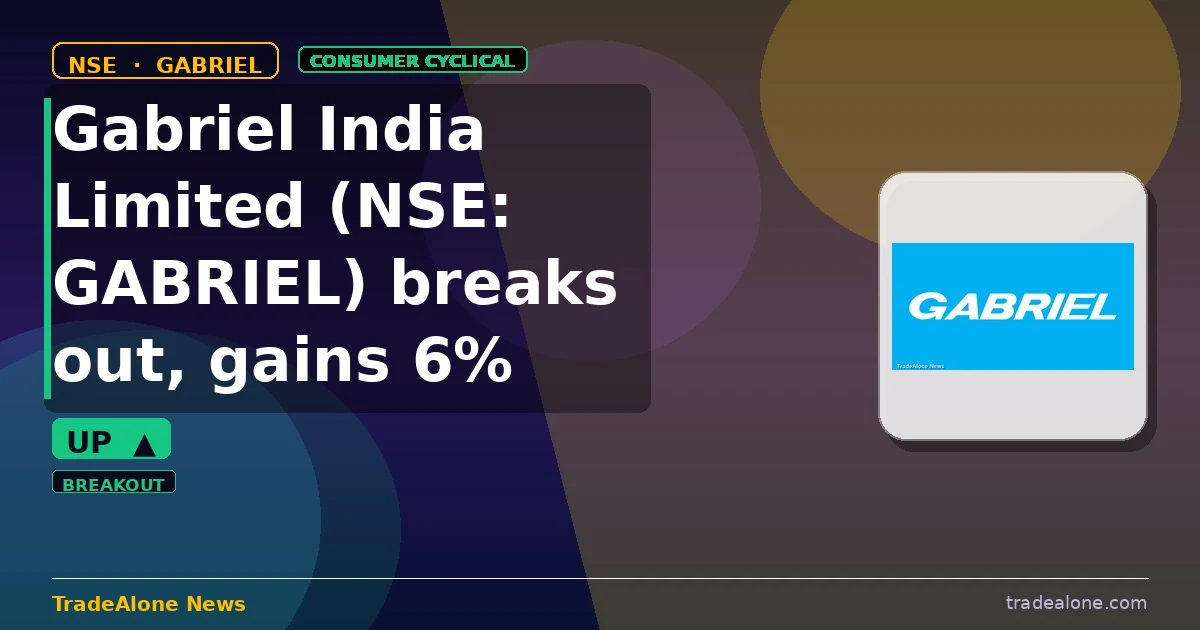
Gabriel India Limited (GABRIEL) breaks out, gaining +6% to clear its 6M resistance trendline. This move is driven by strong technical momentum as the stock surpassed the key resistance level of ₹1365, marking an 8.4% clear. In the context of the auto parts sector, GABRIEL’s surge is notable as it indicates robust demand and operational efficiency, potentially outperforming broader sector trends.
Technical setup — trendlines & DMA
The current trendline structure shows a solid support floor at ₹1016.83, which is 31.72% below today’s price, indicating a strong base. Resistance was previously at ₹1364.85, which the stock has now broken above by 8.35%. The 50-DMA at ₹1157.7 is above the 200-DMA at ₹1050.1, signaling a bullish trend. GABRIEL is currently 21% above the 50-DMA, suggesting an extended move. Within the 52-week range of ₹795.7 to ₹1453.0, the stock is in the upper third, reflecting substantial upside from the lows and nearing the highs, which implies that much of the positive sentiment is already priced in.
Snapshot: ₹1,489.20 on 2026-07-21 (chart frozen at publication)
Fundamentals & business context
With a PE of 79.8 and profit margins at 5.4%, GABRIEL’s valuation appears stretched relative to its current earnings, especially given its revenue CAGR of 16.5%. This suggests that the market may be pricing in future growth and improvements in profitability. Institutional ownership stands at 15.3%, indicating a cautious but present interest from smart money. There is no NSE catalyst today, so the move is purely technical.
Algorithmic scorecard
The overall score of 82 reflects a technically strong stock with fundamental weaknesses. The strongest signals are the bullish trend, with the 50-DMA above the 200-DMA, and the breakout above resistance levels with strong momentum. These indicators suggest systematic accumulation and positive market sentiment. On the flip side, the weakest signals are the low profit margin of 5.4% and the overvalued PEG of 3.32, which highlight the risks of thin profits and expensive valuation relative to growth. These factors could pose challenges if market conditions change or if the company fails to meet growth expectations.
Company outlook
Management provided forward-looking guidance indicating the start of production for Hyundai sunroof variants by December 2027, expected to generate an annual turnover of around INR120 crores. Commercialization of solar dampers is slated for the first half of FY ’27. The company expects to utilize the second line at over 60% to 70% due to recent wins and plans to increase localization from 33% to 60% within the next 1-1.5 years. Additionally, GABRIEL aims to add capacity in the 2-wheeler segment to meet rising demand and is evaluating M&A opportunities and organic growth initiatives aligned with the group’s ambitious plan for 2030.
Get all details on GABRIEL — P&L, peers, shareholding and more on TradeAlone.







Auto Parts
Kross Limited (kross) Forward Integrates into Cold Drawn Tubes Manufacturing
Kross Limited (KROSS) announces forward integration into Cold Drawn Tubes manufacturing, underscoring commitment to innovation and self-reliance.

Kross Limited (KROSS) has announced its forward integration into the manufacturing of Cold Drawn Tubes, marking a significant step towards greater self-reliance and innovation in critical component production. This strategic move underscores the company’s commitment to adopting advanced technologies and enhancing operational efficiency. Commenting on the development, Mr. Sudhir Rai, Chairman & Managing Director, highlighted the company’s robust performance in Q2 FY27, with year-on-year revenue, EBITDA, and PAT growth of 79.6%, 107.4%, and 143.5% respectively.
Strategic Capacity Expansion
The capacity expansion investments are expected to support the company’s growth trajectory, with improved utilisation anticipated in the upcoming quarters. Supported by a healthy order book and sustained demand in the trailer and tractor segments, Kross Limited is well-positioned to deliver healthy growth in FY27. The company’s focus remains on profitable growth, operational efficiency, and strategic capacity investments.
Commitment to Innovation
Through continued emphasis on innovation, operational excellence, and strategic capacity investments, Kross Limited is capitalizing on the recovery in key segments while strengthening its competitive position. The company remains confident that these initiatives, combined with strong execution visibility and contributions from new products, will drive sustainable revenue growth, improved profitability, and long-term value creation for its shareholders.
Kross Limited, an integrated automotive component manufacturer with over three decades of experience, specializes in trailer axles, suspension assemblies, and safety-critical forged, cast, and machined components for M&HCVs, tractors, and off-highway vehicles. The company is backward integrated across design, forging, casting, heat treatment, machining, and surface coating, and is among the prominent trailer axle & suspension manufacturers in India. For further information, please contact Kross Ltd at investors@krossindia.com or +91 7280026478.
Source: NSE Corporate Announcement
Fundamental & Technical Analysis of Kross Limited
Kross Limited belongs to the Consumer Cyclical › Auto Parts sector. Here’s a quick read on where the business and the stock stand today.
Kross gains 41.5% over three months and trades near its 52-week highs. Thin margins at 8.1% leave limited room for error — any demand softness or cost spike hits the bottom line hard. Revenue grows at 12.9% and profits at 21.3% CAGR. The market consistently rewards this kind of compounding. Buyers show up with 3.2x the volume of sellers. Moreover, they dominated on 16 of recent sessions versus 14 for sellers — a healthy accumulation pattern. Both the business and the stock move in the right direction. Revenue grows at 12.9%, profits at 21.3%, and the PEG sits at 1.43 — below its growth rate. That combination is rare. Check Fundamentals of Kross Limited.
Auto Parts
Varroc Engineering Limited (varroc) to Form Joint Venture with Forsee Power to Scale EV Battery Solutions
Varroc Engineering Limited (VARROC) and Forsee Power to form joint venture to scale EV battery solutions in India, strengthening Varroc’s position in electri.

Varroc Engineering Limited (VARROC) has announced its entry into a joint venture with Forsee Power to scale electric vehicle (EV) battery solutions in India. This strategic partnership aims to combine Varroc’s automotive engineering capabilities and manufacturing expertise with Forsee Power’s established expertise in battery-pack technology and systems. The joint venture will focus initially on battery packs for three-wheelers, with plans to expand to two-wheelers, light commercial vehicles, buses, trucks, off-highway, and industrial vehicles.
Strategic Collaboration
The collaboration between Varroc and Forsee Power is designed to leverage their complementary strengths to develop advanced battery-pack solutions adaptable to different vehicle architectures and operating conditions. Arjun Jain, Whole Time Director & CEO – Business I, Varroc, highlighted that this partnership represents an important step in expanding Varroc’s portfolio to address the evolving needs of the market and the future of mobility. Christophe Gurtner, Chairman and CEO of Forsee Power, emphasized the clear opportunity for scaling with the rapid growth of electric mobility adoption in India.
Joint Venture Details
As part of the transaction, Varroc will acquire a 45% equity stake in Forsee Power India, Forsee Power’s Indian subsidiary focused on battery-pack systems, and will exercise management and operational control over the entity. The joint venture aims to build scalable, cost-effective, and application-specific solutions that support Original Equipment Manufacturers (OEMs) across an expanding range of vehicle segments. The joint venture is proposed to operate in India subject to applicable regulatory and corporate approvals.
This move reinforces Varroc’s commitment to anticipating the future of mobility, expanding its technology portfolio, and supporting OEMs with solutions that enable safe, smart, and sustainable mobility.
Source: NSE Corporate Announcement
Fundamental & Technical Analysis of Varroc Engineering Limited
Varroc Engineering Limited belongs to the Consumer Cyclical › Auto Parts sector. Here’s a quick read on where the business and the stock stand today.
Varroc gains 26.6% over three months and trades near its 52-week highs. Razor-thin margins below 5% make profitability extremely vulnerable — this business needs scale or pricing power urgently. 1 loss quarter(s) over five years signals earnings fragility — not chronic but worth noting. The stock gives back 1.9% in the last month despite a positive three-month run. As a result, the earlier momentum appears to be fading. Revenue grows at 8.7% and the stock moves sideways over three months. Neither side makes a strong case. The next earnings print will likely break this stock out of its current range. Check Fundamentals of Varroc Engineering Limited.
Auto Parts
Ceat Limited Q2 FY27: Investor Presentation Highlights Road to Siberia Expansion
CEAT Limited (CEATLTD) Q2 FY27 investor presentation on October 14, 2026, reveals strategic growth and expansion plans, including the Road To Siberia initiat.

CEAT Limited (CEATLTD) is set to unveil its Q2 FY27 investor presentation on October 14, 2026, highlighting strategic growth and expansion initiatives. The presentation will focus on the company’s robust financial performance and ambitious plans, particularly the ‘Road To Siberia’ expansion project. The company reported a revenue of Rs. 4,762 crore for Q2 FY27, marking a healthy year-on-year growth of 26.2% and a quarter-on-quarter increase of 10.3%.
Financial Performance
The consolidated revenue for Q2 FY27 stood at Rs. 4,762 crore, driven by a significant increase in both volume and realization across various segments. The company’s gross margin expanded by 66 basis points quarter-on-quarter, although it contracted by 635 basis points year-on-year due to rising raw material costs. The EBITDA margin for the quarter was 9.5%, up 94 basis points QoQ but down 403 basis points YoY. The company’s debt-to-equity ratio improved to 0.77x from 0.65x in Q1 FY27, reflecting better financial health.
Strategic Expansion
A highlight of the presentation will be CEAT Limited’s strategic expansion plans, particularly the ‘Road To Siberia’ initiative. This project aims to leverage the company’s technological prowess and market presence to tap into new markets and drive future growth. The expansion is expected to enhance the company’s market position and contribute to long-term profitability.
As CEAT Limited continues to grow, the company remains committed to maintaining its operational excellence and delivering value to its stakeholders. The upcoming investor presentation will provide deeper insights into these strategic initiatives and financial metrics, setting the stage for future growth and success.
Source: NSE Corporate Announcement
Fundamental & Technical Analysis of CEAT Limited
CEAT Limited belongs to the Consumer Cyclical › Auto Parts sector. Here’s a quick read on where the business and the stock stand today.
CEAT falls 12.3% over three months and has not found a floor yet. The PEG of 0.42 is extremely low. Either the market misses the growth story, or there is a catch worth investigating. Razor-thin margins below 5% make profitability extremely vulnerable — this business needs scale or pricing power urgently. Buyers show up with 1.4x the volume of sellers. Moreover, they dominated on 16 of recent sessions versus 14 for sellers — a healthy accumulation pattern. Revenue grows at 11.6% and profits at 55.4% CAGR, with D/E of 0.49. Meanwhile, the stock dips 12.3% in three months without any fundamental deterioration. Consequently, the stock quietly becomes cheaper relative to earnings power. For long-term investors, that is a feature. Check Fundamentals of CEAT Limited.
-
 Industrials3 days ago
Zen Technologies Limited to Acquire Majority Stake in Cogknit Semantics
-
 BAJFINANCE2 days ago
Bajaj Finance Limited (bajfinance) Q2 FY27: AUM, PBT Surge, ROE Hits 20.6%
-
 Consumer Defensive2 days ago
Krishival Foods Limited (krishival) Appoints Vivek Kumar Jain as Chief Business Officer
-
 Energy3 days ago
Oil India Limited (OIL) Achieves Landmark Milestone with Special CBM Block Signing
-

 AARTECH2 days ago
Aartech Solonics Limited’s Subsidiary Signs Mou for Energy Storage Cooperation
-
 Basic Materials3 days ago
Vedanta Limited (vedl) Doubles Zinc Production Capacity in South Africa with $600 Mn Investment
-

 Consumer Defensive2 days ago
Mangalam Global Enterprise Limited (mgel) Q2 FY27: PBT Rises 41.85% Yoy to ₹12.27 Crore; Strengthens NEAT Everyday Business Presence Across India
-

 Industrials2 days ago
Waaree Renewable Technologies Limited (waareertl) Q2 FY27: 36.53% Yoy Revenue Growth