
Credit Services
Sundaram Finance Limited (SUNDARMFIN) +7%: Approaching Resistance
Sundaram Finance Limited (NSE: SUNDARMFIN) stock price up by +7% to ₹4466.0. Trendline status shows it is approaching resistance at ₹4490.

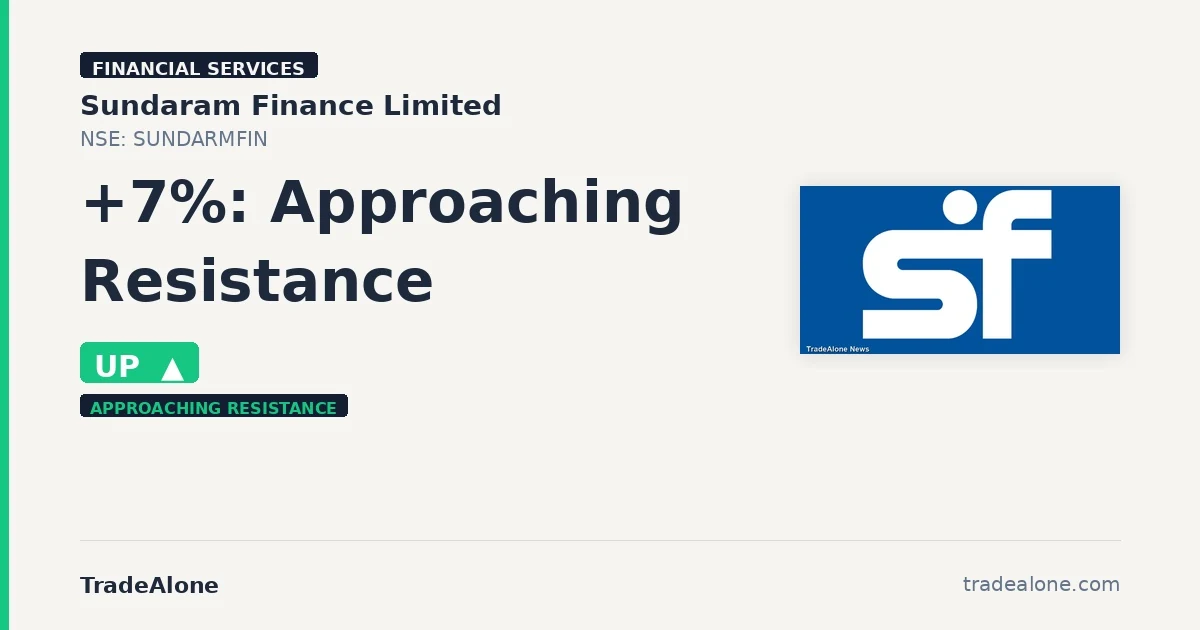
Sundaram Finance Limited (SUNDARMFIN) gained +7% to ₹4466.0 on the NSE on 15 Jun 2026. The stock is now approaching resistance at ₹4490, just 0.5% away, after shifting from a consolidating downtrend. Sundaram Finance, a key player in the financial services sector under credit services, has shown resilience despite sector headwinds, indicating a company-specific momentum rather than broad sector alignment.
Technical setup — trendlines & DMA
Currently, Sundaram Finance is trading above its 6M support floor at ₹3928.83, which is 12.03% below today’s price, and is nearing the 6M resistance trendline end at ₹4489.62. The stock is below both its 50-DMA at ₹4559.7 and 200-DMA at ₹4804.9, indicating a bearish trend. However, the stock is in the lower third of its 52W range, trading at 28.4% of the range, which suggests there might be room for further upward movement if it can break through the immediate resistance.
Snapshot: ₹4,466.00 on 2026-06-15 (chart frozen at publication)
Fundamentals & business context
With a PE of 23.9 and profit margins at 45.6%, Sundaram Finance shows strong profitability, though the valuation might appear stretched given its revenue CAGR of 18.8%. The 15.5% institutional ownership suggests that while the stock has potential, institutional investors are cautiously optimistic. There was no NSE catalyst today, indicating that the move is driven by technical factors rather than new fundamental information.
Algorithmic scorecard
The overall scorecard reflects a balanced view, with strong fundamental indicators offset by weaker technical signals. The revenue CAGR of 18.8% and profit CAGR of 15.7% highlight robust business growth, while the excellent efficiency with a 45.6% profit margin underscores strong operational performance. On the flip side, the stock’s bearish trend, indicated by the 50-DMA being below the 200-DMA, and its position in the lower half of the 52W range, signal technical challenges. The negligible dividend yield of 0.96% also suggests limited income generation for investors, adding to the risk profile.
Get all details on SUNDARMFIN — P&L, peers, shareholding and more on TradeAlone.








Credit Services
Spandana Sphoorty Financial Limited (spandana) Q2fy27: AUM Grows 10% Qoq to ₹5,364 Cr, PPOP Improves
Spandana Sphoorty Financial Limited (NSE: SPANDANA) reports 10% QoQ growth in AUM to ₹5,364 Cr and a 98% improvement in PPOP for Q2FY27.

Spandana Sphoorty Financial Limited (NSE: SPANDANA) announced its unaudited financial results for the quarter and half year ended Sep 30th, 2026. The company reported a 10% QoQ growth in Assets Under Management (AUM) to ₹5,364 crore and a significant improvement in Pre-Provision Operating Profit (PPOP) by 98% QoQ to ₹79 crore.
Strong AUM and Disbursement Growth
The AUM growth was driven by an 8% QoQ increase in disbursements to ₹1,481 crore. The company’s focus on strengthening its four pillars—Portfolio Quality, Productivity, Capital, and People—has paid off, translating into improved financial performance. The collection efficiency remained robust, with gross collection efficiency improving to 97.9% in Q2FY27.
Improved Asset Quality and Profitability
The consolidated Gross Non-Performing Advances (GNPA) and Net Non-Performing Advances (NNPA) improved to 2.54% and 0.50%, respectively. The company’s net interest income rose 25% QoQ to ₹169 crore, indicating a healthy financial performance. The liquidity position remains strong with ₹1,379 crore at the end of Sep 2026.
Forward-Looking Statement
Spandana Sphoorty Financial Limited is entering the next phase from a position of resilience, with a focus on calibrated growth, disciplined execution, and improving portfolio quality. The management remains optimistic about the company’s path towards sustainable profitability.
Source: NSE Corporate Announcement
Fundamental & Technical Analysis of Spandana Sphoorty Financial Limited
Spandana Sphoorty Financial Limited belongs to the Financial Services › Credit Services sector. Here’s a quick read on where the business and the stock stand today.
Spandana falls 28.6% over three months and has not found a floor yet. D/E reaches 2.15. High leverage in this environment is a material risk the market cannot ignore. Industry-leading margins of 116.2% reflect exceptional pricing power and operational efficiency. The stock sits at 22% of its 52-week range, close to annual lows. Historically, value investors build positions at these levels — though cheap stocks can stay cheap. Revenue grows at -10.3%, D/E stands at 2.15, and the stock falls 28.6% in three months. High debt and a falling stock leave little flexibility. Therefore, wait for either the debt to improve or the price to correct before stepping in. Check Fundamentals of Spandana Sphoorty Financial Limited.
Credit Services
Indostar Capital Finance Limited Q2 Fy’27: Disbursements ₹ 1,399 Crore Up 51% Yoy
IndoStar Capital Finance Limited (INDOSTAR) reports Q2 FY’27 disbursements up 51% YoY to ₹ 1,399 crore, with AUM growing to ₹8,459 crore.


IndoStar Capital Finance Limited (INDOSTAR) announced its financial results for the quarter ended September 30th, 2026. The company’s disbursements increased by 51% year-on-year to ₹ 1,399 crore, reflecting strong business momentum across its focus segments. The Asset Under Management (AUM) grew to ₹ 8,459 crore, representing a 12% year-on-year growth. Net Interest Income (NII) crossed ₹ 200 crore, marking a growth of 27% year-on-year.
Operational Highlights
The pre-provision operating profit rose to ₹ 109 crore with a year-on-year growth of 58%. The company continued to strengthen its funding profile, with its weighted average cost of funds declining to 9.7% in Q2 FY27 from 10.4% in Q2 FY26, an improvement of 70 basis points. Gross Stage 3 assets stood at 4.5%, while Net Stage 3 assets were 2.4%.
Strategic Initiatives
IndoStar continued to make progress on its key strategic priorities. The company maintained a disciplined approach to credit risk through comprehensive borrower assessment and proactive identification of potential stress indicators. The branch network expanded to 475 locations across 24 states and union territories, adding 7 branches during the quarter.
As a result, the company is well-positioned to leverage its strategic initiatives and continued growth in the financial sector.
Source: NSE Corporate Announcement
Fundamental & Technical Analysis of IndoStar Capital Finance Limited
IndoStar Capital Finance Limited belongs to the Financial Services › Credit Services sector. Here’s a quick read on where the business and the stock stand today.
IndoStar drops 27.8% over three months and trades near its 52-week lows. D/E of 1.90 is elevated. As a result, debt servicing will compress free cash flow in a high-rate environment. Razor-thin margins below 5% make profitability extremely vulnerable — this business needs scale or pricing power urgently. The stock sits at 14% of its 52-week range, close to annual lows. Historically, value investors build positions at these levels — though cheap stocks can stay cheap. Revenue grows at 6.4% CAGR and the PEG stands at 99.00. The growth does not match the price the market asks. Furthermore, flat price action adds no technical catalyst. A lower price or faster revenue growth would improve the odds. Check Fundamentals of IndoStar Capital Finance Limited.
Credit Services
Shalibhadra Finance Limited (NSE: Sahlibhfi) Slashes Incremental Cost of Borrowing
Shalibhadra Finance Limited (NSE: SAHLIBHFI) announces a significant reduction in incremental cost of borrowing, lowering rates by 0.80% in 6 months.

Shalibhadra Finance Limited (NSE: SAHLIBHFI) is pleased to announce a substantial reduction in its incremental cost of borrowing. This strategic move marks a significant milestone for the company as it continues to serve India’s unbanked and underserved regions. Since April 2026, the company has successfully reduced its borrowing cost by 0.80% through the use of Listed Non-Convertible Debentures (NCDs).
Effective Cost Reduction Strategy
The company’s proactive approach to debt management has resulted in a notable decrease in interest rates. Specifically, from April 2026 to October 2026, the borrowing cost via NCDs has dropped from 12.00% to 11.20%. This reduction is a testament to the company’s effective financial strategy and its ability to navigate the market efficiently.
Impact on Customers and Profitability
This drastic reduction in borrowing costs will enable Shalibhadra Finance Limited to offer lower interest rates to its customers, thereby enhancing its competitive advantage. Additionally, the lower borrowing rates will positively impact the company’s net interest margins (NIMs) and overall profitability. The company plans to continue leveraging NCDs as a vital tool for raising debt, anticipating further reductions in borrowing rates in the future.
Source: NSE Corporate Announcement
Fundamental & Technical Analysis of Shalibhadra Finance Limited
Shalibhadra Finance Limited belongs to the Financial Services › Credit Services sector. Here’s a quick read on where the business and the stock stand today.
Shalibhadra moves sideways over three months, with neither buyers nor sellers taking control. The PEG of 0.37 is extremely low. Either the market misses the growth story, or there is a catch worth investigating. Industry-leading margins of 54.2% reflect exceptional pricing power and operational efficiency. The stock holds at 41% of its 52-week range with RSI at 47. In other words, neither side has a clear edge right now. Revenue grows at 14.0% and profits at 32.5%. The business is in good shape. Moreover, a stock that does not move despite strong fundamentals often offers better value than one already priced for perfection. Check Fundamentals of Shalibhadra Finance Limited.
-
 Information Technology Services3 days ago
Ltm Limited (LTM) Launches GCC Origin: a New Independently Operated Business Unit for Next-generation Global Capability Centers
-

 ARKADE2 days ago
Arkade Developers Limited (arkade) Q2 FY27: Collections Surge 22%, Strategic Project Launch Plans
-
 Capital Markets2 days ago
Emkay Global Financial Services Limited (emkay) Q2 FY27: Revenue Up 103%, PAT Surges 6,100%
-
 COFORGE3 days ago
Coforge Limited (NSE: Coforge) Partners with Chippenham RFC to Boost Community Rugby and Cricket Participation
-

 Consumer Cyclical2 days ago
Crompton Greaves Consumer Electricals Limited Expands Water Heating Portfolio with New 5.9L Instant Water Heaters
-
 Energy2 days ago
Refex Industries Limited (NSE – Refex) Q2 FY27: Revenue Up 36.1%, PAT Rises 13.1%
-
 Consumer Defensive2 days ago
Vst Industries Limited (vstind): Year-to-date Performance Under Pressure Due to Extraordinary Tax Increase
-
 Basic Materials2 days ago
Gulf Oil Lubricants India Limited (gulfoillub) Q2 FY27: Revenue Up 44%, PAT Rises 34%