
ASHOKA
Ashoka Buildcon Limited Q4 & FY26: Developing Infrastructure for Better Tomorrow
Ashoka Buildcon Limited (NSE: ASHOKA) reports Q4 FY26 results with a 10% drop in total income and 7% decline in EBITDA.


Ashoka Buildcon Limited (NSE: ASHOKA), an integrated EPC, BOT, and HAM player, reported its audited financial results for the quarter and full year ended 31st March 2026. The company’s total income for Q4 FY26 was Rs. 1,818.6 crore, a 10% decrease from Rs. 2,012.4 crore in Q4 FY25. The EBITDA stood at Rs. 168.2 crore, down 7% from Rs. 180.7 crore in the same period last year. Despite these declines, Ashoka Buildcon Limited continues to focus on developing infrastructure for a better tomorrow.
Financial Performance
The company’s consolidated debt is Rs. 2,778 crores, comprising Rs. 70 crores of equipment loans, Rs. 757 crores of working capital loans, and Rs. 300 crores of NCDs. The order book summary as on 31st March 2026 is Rs. 15,312 crore, excluding orders received post 31st March 2026 of Rs. 681 crores.
Recent Developments
Ashoka Buildcon Limited has secured several significant contracts. Notably, the company’s wholly-owned subsidiary in Saudi Arabia, in joint venture with BEC Arabia Contracting Co., received a Letter of Acceptance (LOA) from Diriyah Company for the main construction works of Diriyah II – Delivery Partner for One Hotel for a consideration of SAR 717 million. Additionally, the company’s JV with Aakshya Infra Project secured an LOA for the construction of H.L.R.C.C. Bridge over River Gandak in Bihar for Rs. 474.4 crore.
Future Outlook
Ashoka Buildcon Limited remains committed to its mission of developing infrastructure for a better tomorrow. With a robust order book and strategic expansions, the company is well-positioned to drive growth and deliver on its long-term vision.
Source: NSE Corporate Announcement
Fundamental & Technical Analysis of Ashoka Buildcon Limited
Ashoka Buildcon Limited belongs to the Industrials › Engineering & Construction sector. Here’s a quick read on where the business and the stock stand today.
Ashoka falls 10.1% over three months and has not found a floor yet. The PEG of 0.04 is extremely low. Either the market misses the growth story, or there is a catch worth investigating. Industry-leading margins of 34.4% reflect exceptional pricing power and operational efficiency. Buyers show up with 1.4x the volume of sellers. Moreover, they dominated on 16 of recent sessions versus 14 for sellers — a healthy accumulation pattern. Revenue grows at 14.4% and profits at 29.6% CAGR, with D/E of 0.00. Meanwhile, the stock dips 10.1% in three months without any fundamental deterioration. Consequently, the stock quietly becomes cheaper relative to earnings power. For long-term investors, that is a feature. Check Fundamentals of Ashoka Buildcon Limited.













ASHOKA
Ashoka Buildcon Limited (ASHOKA) breaks out +6%
Ashoka Buildcon Limited (ASHOKA) stock price rises by +6% to ₹131.63, breaking out above resistance at ₹120.

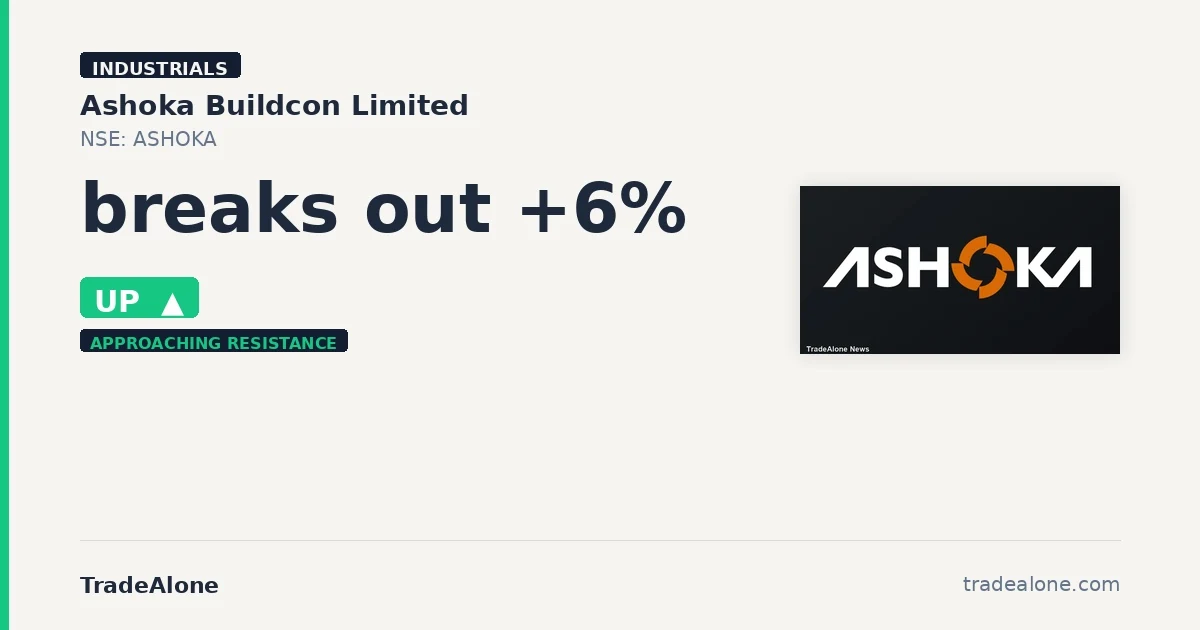
Ashoka Buildcon Limited (ASHOKA) gained +6% to approach its resistance level, signaling a potential shift in trend from support to resistance. This move is driven by the stock clearing the key resistance level of ₹120 by 9.0%, indicating a bullish breakout. Ashoka Buildcon, a player in the industrials sector under engineering and construction, has shown a company-specific move rather than aligning with broader sector momentum.
Technical setup — trendlines & DMA
The current trendline structure shows a 6M support floor at ₹133.12, slightly above today’s price, while the resistance level was at ₹119.78, which the stock has now broken above by 9.0%. The 50-DMA at ₹127.8 is below the 200-DMA at ₹155.1, indicating a bearish trend, but the stock is currently trading above the 50-DMA, suggesting a potential recovery. The stock is in the lower third of its 52W range, trading at 26% above its 52W low and 39.7% below its 52W high, implying there is room for further upside if the breakout sustains.
Snapshot: ₹131.63 on 2026-06-15 (chart frozen at publication)
Fundamentals & business context
With a PE of 5.2 and profit margins at 33.9%, Ashoka Buildcon appears undervalued relative to its earnings, especially considering its slow revenue CAGR of 0.7% but excellent profit CAGR of 105.8%. This suggests the market may be pricing in a turnaround or expecting future growth. The 17.8% institutional ownership indicates a cautious but present interest from smart money, though the lack of a recent NSE catalyst suggests the move is more technical than driven by new fundamental news.
Algorithmic scorecard
The overall scorecard reflects a balanced view of Ashoka Buildcon, with a slight edge towards fundamental strength. The strongest signals include the excellent profit margin of 33.9%, indicating strong profitability, and the undervalued PEG of 0.05, suggesting the stock is cheap relative to its growth. On the weaker side, the negligible dividend yield of 0% offers little income for investors, and the moderate debt level with a D/E ratio of 0.54 introduces some leverage risk. These factors together paint a picture of a company with solid profitability and growth potential, but also with risks related to income generation and debt levels.
Company outlook
Management expects 20% revenue growth in FY27, targeting EBITDA margins between 9.5% and 10.5%. They aim to reduce debt levels to INR500 crores to INR600 crores by March 2027 and anticipate additional cash inflows from monetization to further reduce the working capital cycle.
Get all details on ASHOKA — P&L, peers, shareholding and more on TradeAlone.
ASHOKA
Ashoka Buildcon Limited (ASHOKA) surges 9.52% on project wins
Ashoka Buildcon Limited (ASHOKA) stock jumped 9.52% today, driven by significant project wins and a positive outlook for FY27.

Ashoka Buildcon Limited (NSE: ASHOKA) saw a sharp intraday move today, surging by 9.52% to close at 123.1. This significant upswing can be attributed to several key factors, including the company’s recent project wins and a bullish outlook for the coming fiscal year.
Technical Indicators and Volume Surge
From a technical standpoint, ASHOKA is currently in a consolidation phase on the 3-month chart and is approaching support on the 6-month chart. The stock is trading below both its 50-day moving average (DMA) of 127.6 and its 200 DMA of 155.4, indicating a short-term bearish trend. However, the volume today surged to 1,135,913 shares, significantly higher than the 1-month average of 863,431 shares and the 10-day average of 664,485 shares, signaling strong buying interest.
Project Wins and Future Plans
The primary catalyst for today’s move appears to be the company’s recent announcements during its latest concall for Q4FY26. Ashoka Buildcon has secured several important projects, including a significant project in Saudi Arabia worth INR900 crores, a contract in Angola valued at USD72 million (approximately INR690 crores), and a road upgradation project in Liberia worth around INR430 crores. These wins have bolstered investor confidence.
Additionally, the company outlined its future plans, targeting an order inflow of INR8,000 crores to INR10,000 crores in FY27. Ashoka Buildcon also plans to monetize remaining HAM SPVs by June 2026 and is pursuing the sale of key assets within the next 12 to 18 months. The company expects 20% revenue growth in FY27 and aims to reduce debt levels to INR500 crores to INR600 crores by March 2027.
Growth Metrics and Outlook
Over the past five years, Ashoka Buildcon has shown a Revenue CAGR of 0.7% and a Profit CAGR of 105.8%, indicating strong profit growth despite modest revenue increases. The company’s positive outlook for FY27, including targeted EBITDA margins of 9.5% to 10.5%, further supports today’s bullish move.
For more detailed fundamentals, visit ASHOKA fundamentals on TradeAlone.
In conclusion, today’s sharp move in Ashoka Buildcon Limited can be attributed to its recent project wins, robust future plans, and a positive outlook for FY27. Investors are likely to remain optimistic as the company continues to secure significant contracts and improve its financial metrics.
Price & Trendline Chart
Snowflake Analysis
[ta_stock_snowflake symbol=”ASHOKA”]
Holdings Analysis — Strengths & Risks
Fundamental & Technical Scorecard
-
 BHARATFORG2 days ago
Bharat Forge Limited (bharatforg) Secures Long-term Contract with Pratt & Whitney Canada
-
 Industrials2 days ago
Sepc Limited (NSE: SEPC) Gets Major Relief as Madras High Court Lifts Attachment on ₹154 Crore
-

 MAPMYINDIA2 days ago
C.e. Info Systems Limited (mapmyindia) Partners with Mathworks to Accelerate ADAS Validation for Indian Roads
-
 AXISCADES2 days ago
Axiscades Technologies Limited Initiates Voluntary Solvent Liquidation of German Subsidiary
-

 BHARTIARTL2 days ago
Bharti Airtel Limited Launches IQ Gateway: India’s First Business Communications Platform with Telco-grade Network Intelligence for Safe Enterprise Messaging
-
 Healthcare1 day ago
Zydus Lifesciences Limited Launches First Generic of Adempas® in the U.S.
-

 CAPTRUST2 days ago
Capital Trust Limited Expands Gold Loan Business with A-eye Technology
-
 LASERPOWER2 days ago
Laser Power & Infra Limited (laserpower) Secures ₹72.76 Crore HTLS Reconductoring Order from Powergrid