
KPIGREEN
KPI Green Energy Limited (NSE: KPIGREEN) breaks below support, falls 6% intraday
KPI Green Energy Limited (NSE: KPIGREEN) stock price drops 6% intraday to ₹344.6, breaking below support in the Utilities – Renewable sector.

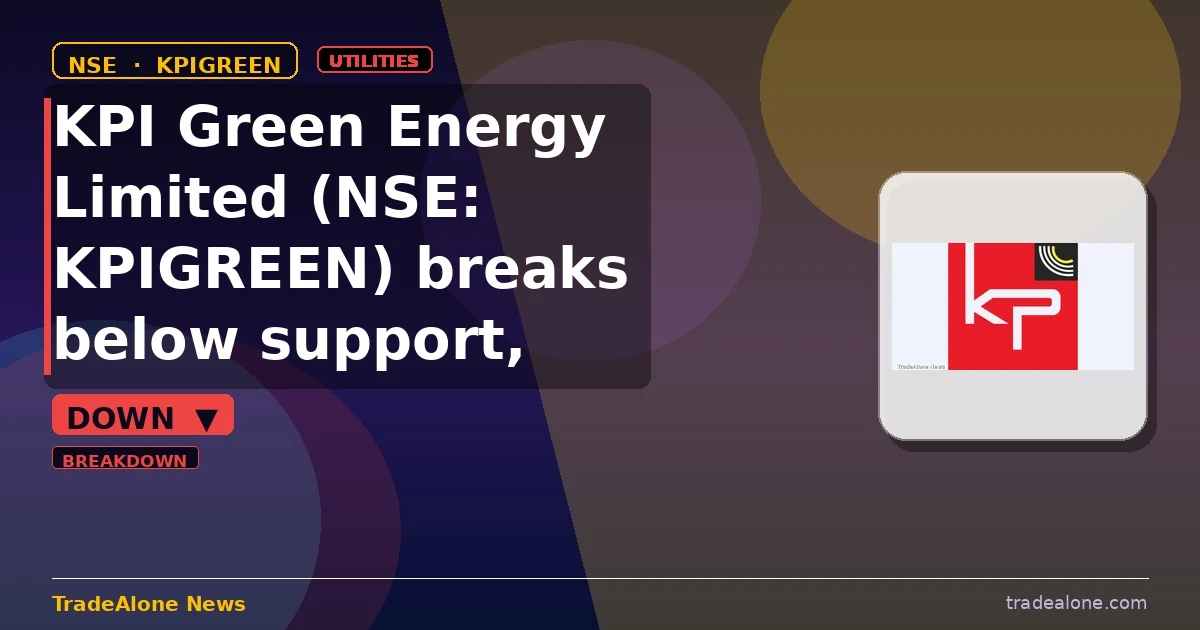
KPI Green Energy Limited (KPIGREEN) fell -6% to ₹344.6 on the NSE on 11 Aug 2026, breaking below its 6-month support trendline. This breakdown occurred despite the company’s recent announcement of an investor presentation and financial results for the period ended Jun 30, 2026. KPI Green Energy, a player in the utilities sector focused on renewable energy, saw this move amid a broader sector context where renewable energy stocks have shown mixed performance. Today’s decline appears to be more company-specific, driven by technical factors rather than sector-wide momentum.
Technical setup — trendlines & DMA
The current 6-month trendline structure shows a breakdown below the support trendline, which ended at ₹378.36, now 9.80% above the current price. Resistance is at ₹399.76, which is 16.01% above the current price. The 50-DMA at ₹398.1 and the 200-DMA at ₹417.9 are both above the current price, indicating a bearish trend. The stock is currently in the lower third of its 52-week range, which suggests that a significant portion of the downside move may already be priced in, though it remains near yearly lows.
Snapshot: ₹344.60 on 2026-08-11 (chart frozen at publication)
Fundamentals & business context
With a PE of 15.3, KPI Green Energy’s valuation appears reasonable given its 17.7% profit margin and robust revenue CAGR of 61.2%. The company’s profit CAGR of 63.2% further supports its growth narrative. However, the 5.3% institutional holding suggests that institutional investors are cautious, possibly due to the stock’s technical weakness and the sector’s volatility. There was no specific NSE catalyst today that would explain the move beyond the technical breakdown.
Algorithmic scorecard
The overall algorithmic scorecard reflects a stock that is fundamentally strong but technically weak. The strongest signals are the excellent revenue and profit CAGRs, indicating robust growth, and the undervalued PEG ratio of 0.24, suggesting the stock is cheap relative to its growth. The weakest signals are the negligible dividend yield of 0.23%, offering little income, and the high public holding of 41.66%, which could lead to higher volatility. The breakdown below support levels and the bearish trend signaled by the DMAs further underscore the technical challenges the stock faces.
Company outlook
Management outlined an ambitious forward guidance, committing to grow at a rate of 40% to 50% year-on-year. They anticipate increasing their IPP portfolio capacity to above 1.7 gigawatts by the end of FY ’27 and expect EBITDA margins to rise as the share of IPP in the overall mix increases. The growth drivers include the IPP and CPP segments, with a target of 40% to 50% year-on-year growth in the CPP segment. Management plans to increase the IPP segment to improve overall profitability and aims to achieve a 10-gigawatt target by 2030, potentially ahead of schedule. They are also focusing on high-margin and faster execution tenders to improve win ratios and participating in state and SECI bidding processes for renewable energy projects.
Get all details on KPIGREEN — P&L, peers, shareholding and more on TradeAlone.








KPIGREEN
KPI Green Energy Limited (NSE: KPIGREEN) breaks below support, moves down 5% intraday
KPI Green Energy Limited (NSE: KPIGREEN) stock price falls to ₹302.5, breaking below support in a fresh intraday breakdown..

KPI Green Energy Limited (KPIGREEN) breaks below support, falling -5% today. The stock has fallen below its 6-month support trendline, triggering a breakdown. KPI Green Energy is a player in the utilities sector, specifically in renewable energy. Today’s move appears to be company-specific, as it does not align with broader sector momentum.
Technical setup — trendlines & DMA
The current 6-month trendline structure shows a breakdown, with the support floor at ₹360.16, which is 19.06% above today’s price. Resistance is at ₹399.76, which is 32.15% above today’s price. The 50-DMA is below the 200-DMA, indicating a bearish trend. The stock is currently 18.75% below the 50-DMA and 23.02% below the 200-DMA, suggesting it is in a downtrend. In the 52-week range of ₹317.0 to ₹542.2, the stock is in the lower third, indicating that much of the downside may already be priced in.
Snapshot: ₹302.50 on 2026-08-17 (chart frozen at publication)
Fundamentals & business context
With a PE of 13.8, profit margins of 16.4%, and a revenue CAGR of 92.0%, KPI Green Energy appears to be undervalued relative to its growth potential. The market seems to be pricing in the company’s strong growth trajectory, rather than its current earnings. Institutional ownership stands at 5.3%, suggesting that the ‘smart money’ is cautiously optimistic but not overly bullish on the stock. There is no NSE catalyst today, indicating that the move is purely technical.
Algorithmic scorecard
The overall score reflects a technically weak but fundamentally strong stock. The two strongest signals are the excellent revenue and profit CAGRs, indicating robust growth, and the undervalued PEG ratio, suggesting the stock is cheap relative to its growth. These signals point to a business with strong growth potential and room for upside. The two weakest signals are the negligible dividend yield, which offers little to no income, and the high public ownership, which could lead to higher volatility. These risks suggest that while the stock has growth potential, it may also be subject to market sentiment and volatility.
Company outlook
Management has committed to growing at a rate of 40% to 50% year-on-year. They anticipate increasing the IPP portfolio capacity to above 1.7 gigawatts by the end of FY ’27 and aim to achieve a 10-gigawatt target by 2030, potentially ahead of schedule. The growth drivers include the IPP and CPP segments, with a focus on high-margin and faster execution projects. Management is also expecting revenue from BESS projects to contribute to the top line by FY ’27-’28. Specific initiatives include participating in state and SECI bidding processes for renewable energy projects and focusing on tenders that offer higher margins and quicker execution.
Get all details on KPIGREEN — P&L, peers, shareholding and more on TradeAlone.
-

 Basic Materials2 days ago
Euro Pratik Sales Limited (europratik) to Acquire 56% Stake in Fab Wood, Expanding into Timber and Value-added Wood Products
-

 INTELLECT2 days ago
Intellect Design Arena Limited Upgrades Cargills Bank’s Core Banking Architecture for the Next Decade
-
 Credit Services2 days ago
Manba Finance Limited (manba) Approves ₹99.99 Crore Fundraise
-
 Industrials2 days ago
One Point One Solutions Limited Secures INR 39.32 Crore Customer Experience Centre of Excellence Mandate
-

 Basic Materials2 days ago
Jindal Stainless Partners with Nasscom’s Futureskills Prime to Enhance Workforce Digital Capabilities
-
 Communication Services3 days ago
Prime Focus Limited Announces Brahma AI Raises $150 Million
-
 AWFIS2 days ago
Awfis Space Solutions Limited (awfis) Launches New Elite Centre in Aerocity
-
 Consumer Cyclical2 days ago
Royal Orchid Hotels Limited Rohltd Expands Presence in Karnataka with Regenta Hubballi Launch