
NLCINDIA
Nlc India Limited Q2 FY27: Coal Production, Revenue, and Profit Surge
NLC India Limited (NLCINDIA) reports a significant surge in coal production, revenue, and profit for Q2 FY27.

NLC India Limited (NSE: NLCINDIA) has announced impressive financial results for the quarter and half year ended 30th September 2026. The company achieved a coal production of 78.55 lakh tonnes (LT) compared to 74.87 LT in H1 2025-26, registering a growth of 4.92%. Coal sales also saw a significant increase, reaching 101.23 LT against 88.37 LT in the same period last year, marking a growth of 14.55%.
Standalone Performance
The thermal power gross generation for the period stood at 8,306.66 MU compared to 7,922.6 MU, reflecting a growth of 4.85%. Total revenue from operations for the half year ended 30th September 2026 is Rs. 5,562.61 crore against Rs. 5,060.51 crore in the corresponding period of the previous year, registering a growth of 9.92%. The total comprehensive income for the period ended 30th September 2026 is Rs. 1,623.41 crore against Rs. 842.25 crore in the same period last year, showing a growth of 92.75%.
Group Performance
The company achieved a gross thermal power generation of 14,621.90 MU compared to 12,249.34 MU in H1 2025-26, registering a growth of 19.37%. Renewable power generation also saw a substantial increase, reaching 1,485.82 MU against 1,126.53 MU in H1 2025-26, marking a growth of 31.89%.
The all-time highest ever revenue from operations for the half year ended 30th September 2026 is Rs. 9,449.10 crore as against Rs. 8,004.02 crore in the corresponding period of the previous year, registering a growth of 18.05%. The all-time highest ever total profit after tax (PAT) for the half year ended 30th September 2026 is Rs. 1,764.34 crore as against Rs. 1,564.01 crore in the corresponding period of the previous year, registering a growth of 12.81%.
The net-worth as on 30th September 2026 stood at Rs. 23,400.83 crore compared to Rs. 19,965.62 crore in the previous year, registering a growth of 17.21%. An interim dividend @ 15% is declared for the year 2026-27.
Source: NSE Corporate Announcement
Fundamental & Technical Analysis of NLC India Limited
NLC India Limited belongs to the Utilities › Utilities – Regulated Electric sector. Here’s a quick read on where the business and the stock stand today.
NLC falls 14.3% over three months and has not found a floor yet. The PEG of 0.30 is extremely low. Either the market misses the growth story, or there is a catch worth investigating. Revenue grows at 2.7% CAGR. The company generates cash but does not compound aggressively. The stock sits at 15% of its 52-week range, close to annual lows. Historically, value investors build positions at these levels — though cheap stocks can stay cheap. Revenue grows at 2.7% and profits at 36.1% CAGR — a genuinely strong business. Nevertheless, the stock drops 14.3% in three months. The market sells the stock, not the story. Watch whether that changes at the next earnings. Check Fundamentals of NLC India Limited.








NLCINDIA
Nlc India Limited (nlcindia) Signs Mou with Ipicol for Major Industrial Projects
NLC India Limited (NLCINDIA) signs MoU with IPICOL for a 3200 MW thermal plant, coal gasification, and beach sand mineral processing in Odisha.

NLC India Limited (NLCINDIA) announced on October 22, 2026, the signing of Memorandums of Understanding (MoUs) with the Industrial Promotion and Investment Corporation of Odisha Limited (IPICOL). The agreements focus on establishing a 3200 MW ultra super-critical coal-based thermal power plant, exploring coal gasification for fertilizer production, and developing a beach sand mineral processing facility in Odisha.
Thermal Power Plant Project
The proposed 3200 MW thermal power plant, involving an investment of Rs.35,000 crore, is expected to generate employment for approximately 4,000 people. This project aims to bolster Odisha’s power infrastructure and support the state’s industrial and economic growth.
Coal Gasification and Fertilizer Production
NLC India Limited will explore the technical feasibility of coal gasification and the production of synthesis gas (Syn-Gas) for potential applications in the fertilizer sector. This initiative seeks to integrate coal gasification with fertilizer production, aligning with the Government of India’s vision of Atmanirbhar Bharat.
Beach Sand Mineral Processing Facility
The beach sand mineral processing facility, with a tentative investment of Rs.2000 crore, is expected to generate employment for around 500 people. This project aims to contribute to industrial development and socio-economic growth in the region.
Through these initiatives, NLC India Limited and IPICOL reaffirm their commitment to partnering in the industrial and infrastructure development of Odisha, supporting its long-term development objectives.
Source: NSE Corporate Announcement
Fundamental & Technical Analysis of NLC India Limited
NLC India Limited belongs to the Utilities › Utilities – Regulated Electric sector. Here’s a quick read on where the business and the stock stand today.
NLC falls 14.3% over three months and has not found a floor yet. The PEG of 0.30 is extremely low. Either the market misses the growth story, or there is a catch worth investigating. Revenue grows at 2.7% CAGR. The company generates cash but does not compound aggressively. The stock sits at 15% of its 52-week range, close to annual lows. Historically, value investors build positions at these levels — though cheap stocks can stay cheap. Revenue grows at 2.7% and profits at 36.1% CAGR — a genuinely strong business. Nevertheless, the stock drops 14.3% in three months. The market sells the stock, not the story. Watch whether that changes at the next earnings. Check Fundamentals of NLC India Limited.
NLCINDIA
NLC India Limited (NSE: NLCINDIA) falls 6% intraday, hits resistance
NLC India Limited (NSE: NLCINDIA) drops 6% intraday to ₹285.75, approaching resistance at ₹286 in the Utilities sector.

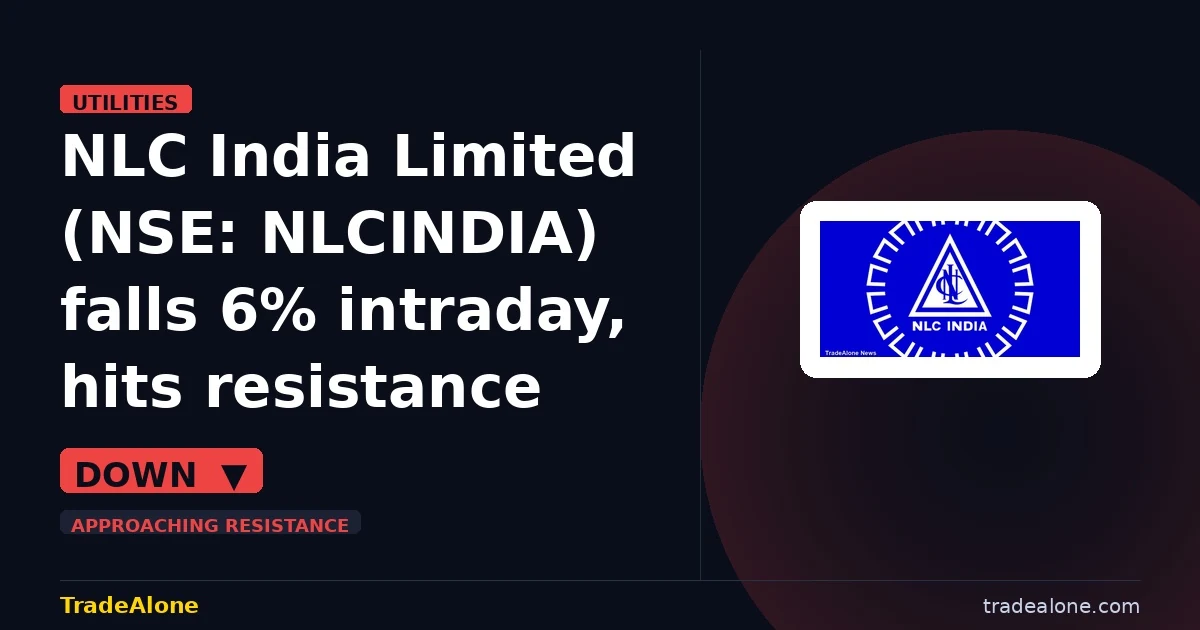
NLC India Limited (NLCINDIA) fell -6% to ₹285.75 on the NSE on 10 Aug 2026. The stock is approaching resistance at ₹286, just 0.1% away, after shifting from hitting resistance. This places NLCINDIA in a critical zone, with near support at ₹277, which is 3.1% below the current price. In the utilities sector, particularly in regulated electric, this move seems company-specific rather than a sector-wide trend.
Technical setup — trendlines & DMA
From a technical perspective, NLCINDIA is currently navigating a delicate zone. The 6-month support trendline is at ₹276.76, which is 3.15% below the current price, offering a cushion. Resistance is at ₹286, mere steps away at 0.09% above the current price. The 50-DMA at ₹312.8 is above the 200-DMA at ₹281.2, signaling a bullish trend, though the stock is currently in recovery mode, trading above the 200-DMA but below the 50-DMA. Within the 52-week range of ₹222.0 to ₹387.8, the current price sits in the middle third, suggesting that while there’s room for further upside, a significant portion of potential gains may already be priced in.
Snapshot: ₹285.75 on 2026-08-10 (chart frozen at publication)
Fundamentals & business context
Fundamentally, NLCINDIA presents an intriguing case. With a PE of 12.0 and profit margins at 20.1%, the stock appears reasonably valued considering its revenue CAGR of 2.7% and profit CAGR of 36.1% over the past five years. The 15.6% institutional ownership indicates a cautious yet positive view from the smart money, suggesting confidence in the company’s long-term prospects despite the recent pullback. There’s no specific NSE catalyst today, making this move more of a technical reaction than a fundamental shift.
Algorithmic scorecard
The overall scorecard reflects a balanced view, with strong technical indicators slightly edging out the fundamental picture. Two of the strongest signals are the bullish trend, indicated by the 50-DMA being above the 200-DMA, and the breakout above resistance levels with momentum, suggesting a positive underlying trend. On the flip side, the slow revenue CAGR of 2.7% and the mixed momentum in price growth represent potential risks. The slow revenue growth could limit upside in a competitive market, while inconsistent price growth might reflect underlying volatility or market sentiment shifts.
Company outlook
Management’s forward guidance is optimistic, with plans to add significant capacity over the next few years. They expect to add 300 megawatts by the end of the current financial year, with an additional 300 megawatts within the next 1.5 months in the following year. Longer-term plans include adding 1 gigawatt annually. Specific projects include the Talabira Phase 2 project, expected to receive environment clearance by the end of H1 next financial year, and the Pugal 810-megawatt project, which is in the final stages of land acquisition. Additionally, NLC India is targeting to add 2 gigawatts in a joint venture with PTC India, with a capex of around ₹10,000 Crore. The company is also venturing into renewable energy, forming joint ventures with various state governments for adding renewable capacity.
Get all details on NLCINDIA — P&L, peers, shareholding and more on TradeAlone.
NLCINDIA
Nlc India Limited (nlcindia) Q1 FY27: Revenue and Profit Surge, Coal Production Up 7.84%
NLC India Limited (NLCINDIA) reports a 15.07% revenue increase and a 3.76% profit growth in Q1 FY27, driven by higher coal production.
NLC India Limited (NLCINDIA) has announced its financial results for the quarter ended June 2026, showcasing significant growth across various metrics. The standalone revenue from operations surged by 15.07% to Rs.2,871.73 Cr compared to Rs.2,495.60 Cr in the same period last year. The profit before tax (PBT) also increased by 3.76% to Rs.548.67 Cr against Rs.528.78 Cr in the previous year.
Coal Production and Power Generation
The company’s coal production rose by 7.84% to 40.85 LT compared to 37.88 LT in Q1 FY26. Moreover, the thermal power gross generation grew by 8.27% to 4,318.85 MU against 3,988.98 MU in the same quarter of the previous year.
EBITDA and Net Worth Growth
The earnings before interest, taxes, depreciation, and amortization (EBITDA) for the quarter ended June 2026 stood at Rs.1,013.13 Cr, a marginal increase of 1.13% compared to Rs.1,001.81 Cr in the previous year. The net worth as on June 30, 2026, was Rs.19,701.70 Cr, reflecting a 10.53% growth from Rs.17,824.83 Cr in the previous year.
Looking ahead, NLC India Limited is poised for continued growth, leveraging its robust operational performance and strategic initiatives.
Source: NSE Corporate Announcement
Fundamental & Technical Analysis of NLC India Limited
NLC India Limited belongs to the Utilities › Utilities – Regulated Electric sector. Here’s a quick read on where the business and the stock stand today.
NLC moves sideways over three months, with neither buyers nor sellers taking control. The PEG of 0.33 is extremely low. Either the market misses the growth story, or there is a catch worth investigating. Premium net margins of 20.1% demonstrate strong cost discipline and a wide competitive moat. The stock gains 3.5% in the last month, recovering from the three-month slide. However, it is too early to call this a confirmed reversal. Both the business and the stock move in the right direction. Revenue grows at 2.7%, profits at 36.1%, and the PEG sits at 0.33 — below its growth rate. That combination is rare. Check Fundamentals of NLC India Limited.
-

 AKUMS3 days ago
Akums Drugs and Pharmaceuticals Limited (akums) Q2 FY27: Revenue Up 32%, Ebitda and PAT Surge
-

 Information Technology Services3 days ago
Orient Technologies Limited (orienttech) Q2 FY27: Strong Profitability on Higher Managed Services Contribution
-

 Consumer Cyclical3 days ago
Tbo Tek Limited (tbotek) Q2 FY27: Revenue Up 53%, Adj. Ebitda at ₹152 Crores
-

 Industrials3 days ago
Amara Raja Energy & Mobility Limited (are&m) Q2 FY27: Revenue Up 13%
-

 Auto Parts3 days ago
Jay Bharat Maruti Limited Q2 FY’27 Results: PAT Up 72.59%, Revenue Grows 41.97%
-
 Basic Materials3 days ago
Jk Paper Limited (jkpaper) Q2 FY26: Consolidated Turnover Up 11%, PAT Rises 36%
-

 Consumer Cyclical3 days ago
Sheela Foam Limited Q2 & H1 FY27 Results: Revenue Surpasses ₹1,000 Cr, PAT Up 6.6x Yoy
-
 Apparel Retail3 days ago
Arvind Fashions Limited Announces Highest Ever Revenue and Ebitda, Delivers Revenue Growth of 10.0% and Ebitda Growth of 15.5%