
ATUL
Atul Limited Clarifies on Treated Effluent Discharge from Atul Site
Atul Limited (ATUL) clarifies incorrect info on effluent discharge into Par river; company reaffirms commitment to environmental compliance.

Atul Limited (ATUL) has issued a clarification regarding incorrect information and videos circulating about the discharge of effluent from its site into the Par river. The company uses a 4-km long pipeline within the estuary to discharge treated effluent, which complies with Gujarat Pollution Control Board standards. During the period, accidental damage in the existing pipeline resulted in a short-term release of treated effluent. The company immediately isolated the affected section and suspended discharge as a precaution. Repairs are underway, and the company does not expect any material impact from this incident. Atul Limited reaffirms its commitment to environmental protection and compliance with all applicable laws.
Pipeline Damage and Immediate Actions
The existing pipeline experienced accidental damage approximately 1 km from the effluent treatment plant. This resulted in the inadvertent release of treated effluent into the estuarine zone until the damage was detected. The treated effluent released complied with the prescribed standards of the Gujarat Pollution Control Board. Upon detection, the company isolated the affected section and suspended effluent discharge through it as a precautionary measure.
Environmental Compliance and Future Steps
The company has obtained necessary approvals for the installation of a new pipeline to mitigate potential environmental risks. A competent agency has been engaged to undertake the required repairs. Discharge through the affected pipeline will remain suspended until repairs are completed and the pipeline is inspected and confirmed fit for safe operation. Atul Limited does not anticipate any material impact from this incident and reaffirms its commitment to environmental protection and compliance with all applicable environmental laws, rules, and regulatory requirements.
Source: NSE Corporate Announcement
Fundamental & Technical Analysis of Atul Limited
Atul Limited belongs to the Basic Materials › Specialty Chemicals sector. Here’s a quick read on where the business and the stock stand today.
Atul moves sideways over three months, with neither buyers nor sellers taking control. The PEG of 2.36 makes it expensive versus peers. The premium needs earnings to catch up quickly. Revenue grows at 4.9% CAGR. The company generates cash but does not compound aggressively. The stock holds at 39% of its 52-week range with RSI at 55. In other words, neither side has a clear edge right now. Revenue grows at 4.9% and the stock moves sideways over three months. Neither side makes a strong case. The next earnings print will likely break this stock out of its current range. Check Fundamentals of Atul Limited.









ATUL
Atul Limited (ATUL) breaks out, gains 5% intraday
Atul Limited (ATUL) stock cleared its 6M resistance trendline, gaining 5% intraday to ₹6739.5. This breakout signifies a strong upward momentum in the specia.

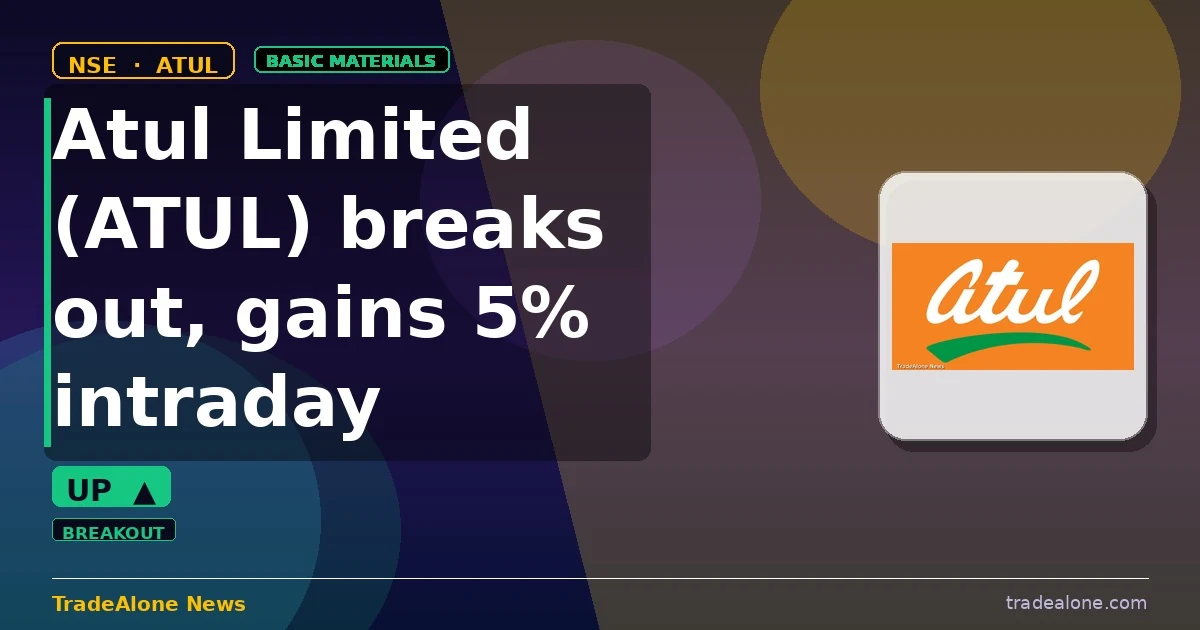
Atul Limited (ATUL) breaks out, gaining +5% to ₹6739.5 on the NSE on 27 Jul 2026. The stock has cleared its 6-month resistance trendline, marking a significant shift from its previous approach to support. This move is particularly notable as it aligns with the company’s recent announcements, including the appointment of Mr. Vinayak Deshpande as an Independent Director and capacity addition plans, which may be contributing to positive sentiment around the stock.
Technical setup — trendlines & DMA
The current trendline structure shows a robust breakout, with the 6-month support floor at ₹5960.97, which is 11.55% below today’s price. The resistance trendline, previously at ₹6492.35, has been decisively cleared by 3.67%. The 50-DMA at ₹6569.0 is above the 200-DMA at ₹6305.4, indicating a bullish trend. However, the stock is currently in recovery mode, trading above the 200-DMA but below the 50-DMA. In terms of its 52-week range, the stock is in the upper third, suggesting that much of the recent momentum may already be priced in.
Snapshot: ₹6,739.50 on 2026-07-27 (chart frozen at publication)
Fundamentals & business context
With a PE of 27.8, Atul Limited’s valuation appears stretched given its profit margin of 10.8% and a revenue CAGR of 4.9%. This suggests that the market may be pricing in future growth or a turnaround, despite the current earnings not fully justifying the high PE. The 29.8% institutional ownership indicates a level of confidence from sophisticated investors, though the recent stock performance and valuation metrics suggest a need for caution. There was no specific NSE catalyst today, but the overall sentiment seems to be driven by the company’s strategic moves and market perception.
Algorithmic scorecard
The overall scorecard reflects a technically strong but fundamentally weaker profile. The breakout above resistance with momentum is a strong positive signal, indicating that the stock has the potential for further upside. Additionally, the bullish sentiment over the last 30 days, with a higher average volume on up days, suggests systematic accumulation. On the weaker side, the overvalued PEG ratio of 2.87 and the negligible dividend yield of 0.49% are significant risks. The overvaluation relative to growth and the lack of income from dividends could pose challenges if market conditions change or if the company fails to meet growth expectations.
Get all details on ATUL — P&L, peers, shareholding and more on TradeAlone.
ATUL
Atul Limited (ATUL) gains 5% intraday, approaches resistance
Atul Limited (NSE: ATUL) stock moves up 5% intraday, nearing resistance at ₹6492. The stock is 0.4% away from the 6-month resistance level.

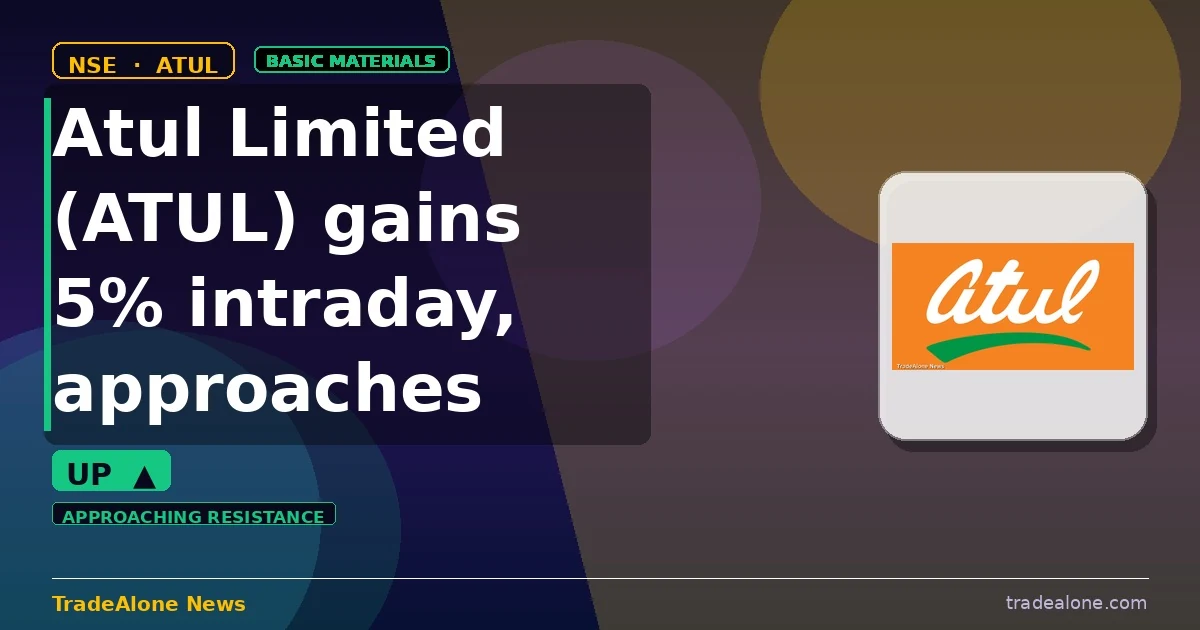
Atul Limited (ATUL) gained +5% to test resistance near ₹6492 on the NSE on 24 Jul 2026. The stock is up intraday but remains below the 6-month resistance trendline, signaling a bounce from support rather than a breakout. This move comes after the company announced the appointment of Mr. Vinayak Deshpande as an Independent Director, effective August 01, 2026, and disclosed capacity addition plans. ATUL operates in the specialty chemicals segment within the basic materials sector, and today’s move appears to be driven by company-specific news rather than broader sector momentum.
Technical setup — trendlines & DMA
The current 6-month trendline structure shows ATUL bouncing from support at ₹5960.97, which is 7.81% below today’s price. The stock is approaching resistance at ₹6492.35, just 0.41% above the current price. The 50-DMA at ₹6602.8 is above the 200-DMA at ₹6302.0, indicating a bullish trend, though the stock is currently trading below both moving averages. ATUL is positioned in the middle third of its 52-week range, suggesting that a significant portion of the recent move may already be priced in.
Snapshot: ₹6,466.00 on 2026-07-24 (chart frozen at publication)
Fundamentals & business context
With a PE of 26.6 and profit margins of 10.8%, ATUL’s valuation appears stretched relative to its current earnings, especially given the revenue CAGR of 4.9%. The market may be pricing in future growth or a potential turnaround, but the current metrics suggest a premium valuation. Institutional ownership stands at 29.8%, indicating that smart money has a moderate level of confidence in the company. There was no specific NSE catalyst today beyond the corporate announcements.
Algorithmic scorecard
The overall algorithmic scorecard reflects a balanced view of ATUL, with moderate strengths and weaknesses. Two of the strongest signals are the very low debt level, with a D/E ratio of 0.00, indicating excellent financial health, and the good stability shown by only one revenue dip in the company’s history. On the weaker side, the negligible dividend yield of 0.48% offers little income for investors, and the overvalued PEG ratio of 2.74 suggests the stock is expensive relative to its growth rate. These factors highlight both the financial solidity and the valuation concerns surrounding ATUL.
Get all details on ATUL — P&L, peers, shareholding and more on TradeAlone.
-
 ARSSBL3 days ago
Anand Rathi Share and Stock Brokers Limited (arssbl) Q2 FY 27: Revenue Up 20% Yoy, PAT Rises 50%
-

 Communication Services3 days ago
Gtpl Hathway Limited: Digital TV Subscriber Increase by 1.5 Mn Drives Revenue Growth
-

 Consumer Cyclical3 days ago
Lemon Tree Hotels Limited Expands in Uttar Pradesh with 26th Property
-
 TATAPOWER2 days ago
Tata Power Advances 2.8 GW+ Data Centre Opportunity Pipeline Across
-
 Software - Application3 days ago
Tata Elxsi Limited (tataelxsi) Q2 Fy’27: Revenue Up 3.4% Qoq, 15% Yoy
-
 Industrials3 days ago
Polycab India Limited (polycab) Announces Appeal Against NCLT Order
-
 Industrials2 days ago
Sigma Advanced Systems Limited (sigmaadv) Partners with Munitions INDIA Limited for Advanced Artillery Technology
-

 Industrials2 days ago
Reliance Industrial Infrastructure Limited (riil) Reports Q2 Fy26-27 Results: Income Down, Profit Margins Narrow