
BHARTIHEXA
Bharti Hexacom Limited (bhartihexa) Q1 FY27: Revenue Up 10.9% Yoy
Bharti Hexacom Limited (BHARTIHEXA) reports Q1 FY27 results with a 10.9% YoY revenue growth to Rs 2,510 crore.

Bharti Hexacom Limited (BHARTIHEXA) announced its audited results for the first quarter ended June 30, 2026, showcasing a robust performance. The company’s total revenue stood at Rs 2,510 crore, marking a 10.9% year-over-year (YoY) growth and a 4.0% quarter-over-quarter (QoQ) increase.
Mobile Services Revenue Growth
The mobile services segment delivered a revenue growth of 9.3% YoY, supported by a higher average revenue per user (ARPU) and continued customer additions. The smartphone data customer base expanded steadily, with 1.3 million new customers added over the past year, representing a 6.0% YoY increase.
Homes, Offices and Other Services Segment
The Homes, Office and Other services segment remained a key growth driver, delivering a remarkable 61.4% YoY revenue growth, driven by strong net customer additions, particularly in Wi-Fi and IPTV offerings. The customer base increased to 0.9 million, and the fiber network footprint expanded to 121 cities.
EBITDA increased 13.0% YoY to Rs 1,375 crore, with a margin expansion of 99 bps YoY to 54.8%. EBIT grew 13.7% YoY to Rs 770 crore, with a margin improvement of 74 bps YoY to 30.7%. Net income (before exceptional items) increased 23.2% YoY to Rs 482 crore. The net debt to EBITDA ratio strengthened to 0.80 compared to 1.30 as of June 30, 2025.
Strong operational performance was underpinned by executional excellence and a continued focus on acquiring quality customers. Bharti Hexacom’s strategic initiatives, including the launch of Postpaid Fast Lane powered by 5G slicing technology, are expected to drive future growth and enhance customer experience.
Source: NSE Corporate Announcement
Fundamental & Technical Analysis of Bharti Hexacom Limited
Bharti Hexacom Limited belongs to the Communication Services › Telecom Services sector. Here’s a quick read on where the business and the stock stand today.
Bharti rises 11.0% over three months, with buying pressure holding steady. Revenue grows at 12.4% and profits at 46.7% CAGR. The market consistently rewards this kind of compounding. Not a single revenue dip or loss quarter in five years — this is a business built to last through cycles. Buyers show up with 1.6x the volume of sellers. Moreover, they dominated on 16 of recent sessions versus 14 for sellers — a healthy accumulation pattern. Both the business and the stock move in the right direction. Revenue grows at 12.4%, profits at 46.7%, and the PEG sits at 1.01 — below its growth rate. That combination is rare. Check Fundamentals of Bharti Hexacom Limited.









BHARTIHEXA
Bharti Hexacom Limited (BHARTIHEXA) bounces back 5% intraday
Bharti Hexacom Limited (NSE: BHARTIHEXA) gains 5% intraday, bouncing back despite a breakdown in the 6-month trendline. Price stands at ₹1568.0.
Bharti Hexacom Limited (BHARTIHEXA) recovered intraday by +5% to ₹1568.0 on the NSE on 13 Aug 2026, despite a breakdown in its 6-month trendline structure. This bounce occurred following the company’s recent corporate announcements regarding its Annual General Meeting held on August 11, 2026. Bharti Hexacom, a key player in the telecom services sector, has shown resilience today, although the broader sector momentum remains subdued. This move appears to be company-specific, driven by internal developments rather than sector-wide trends.
Technical setup — trendlines & DMA
From a technical standpoint, BHARTIHEXA’s 6-month trendline structure shows a breakdown, with the current price sitting below both the 6-month support trendline at ₹1686.64 and the resistance trendline at ₹1728.78. The stock is trading below its 50-DMA of ₹1534.8 and its 200-DMA of ₹1613.1, indicating a bearish trend. Within its 52-week range of ₹1430.0 to ₹1955.6, the current price is in the lower third, suggesting that while there is room for further downside, the stock is not yet at extreme lows. This setup implies that today’s bounce is a recovery within a broader downtrend, rather than a definitive reversal.
Snapshot: ₹1,568.00 on 2026-08-13 (chart frozen at publication)
Fundamentals & business context
On the fundamental front, BHARTIHEXA’s PE of 40.5, coupled with a profit margin of 19.0% and a revenue CAGR of 12.4%, suggests that the market is pricing in future growth expectations rather than current earnings. The company’s strong profit CAGR of 46.7% over the past five years indicates robust earnings growth, which may justify the higher PE. However, the low institutional holding of 11.0% suggests that institutional investors are cautious about the stock. There was no specific NSE catalyst today beyond the routine corporate announcements, indicating that the move is likely driven by internal factors and market sentiment rather than new information.
Algorithmic scorecard
The algorithmic scorecard for BHARTIHEXA reflects a balanced view, with a slight lean towards fundamental strength over technical weakness. The strongest signals from the breakdown include the company’s excellent profit CAGR of 46.7% and its undervalued PEG ratio of 0.87, indicating that the stock is cheap relative to its growth. These signals suggest that the company has strong growth potential and is currently trading at a discount to its growth rate. On the weaker side, the stock’s high debt level with a D/E ratio of 1.20 and its low dividend yield of 1.19% represent risks. The high debt level could pose financial stability risks, especially in a rising interest rate environment, while the low dividend yield offers minimal income contribution to investors. These factors should be carefully considered by investors looking at BHARTIHEXA.
Company outlook
Management’s outlook for BHARTIHEXA is cautiously optimistic. They expect to see an unwinding of the change in acquisition policy in home broadband, leading to improved net adds. Additionally, they anticipate a higher trend of customer additions in mobile towards the second half of the year. Capex is being directed towards 5G densification, network modernization, and growing the homes and IPTV business. The focus is also on improving the quality of acquisition in home broadband to achieve better unit economics. These initiatives suggest that management is committed to enhancing both top-line growth and operational efficiency in the coming periods.
Get all details on BHARTIHEXA — P&L, peers, shareholding and more on TradeAlone.
BHARTIHEXA
Bharti Hexacom Limited (BHARTIHEXA) gains 5% intraday, tests resistance
Bharti Hexacom Limited (NSE: BHARTIHEXA) moves up 5% intraday to ₹1600.0, testing resistance in the Telecom Services sector.

Bharti Hexacom Limited (BHARTIHEXA) tested resistance today, gaining +5% intraday to ₹1600.0 on the NSE. The move is technical, driven by the stock hitting its 6-month resistance trendline at ₹1599. This places BHARTIHEXA in a pivotal position within the Communication Services > Telecom Services sector, where it stands as a large-cap player. Today’s move appears to be company-specific rather than a sector-wide momentum shift, highlighting investor interest in the stock’s potential to clear this resistance level.
Technical setup — trendlines & DMA
From a technical standpoint, BHARTIHEXA’s current price action is intriguing. The stock is now testing its 6-month resistance trendline, which ends at ₹1598.69, just a whisker below today’s price. This resistance is crucial as it represents a key psychological level for the stock. Meanwhile, the 6-month support trendline stands at ₹1429.71, indicating a solid floor for the stock if it were to retreat. The 50-DMA at ₹1499.5 is below the 200-DMA at ₹1635.0, signaling a bearish trend in the longer term. However, BHARTIHEXA’s current price is in the lower third of its 52-week range, suggesting there’s room for further upside if the stock can sustain its momentum above resistance.
Snapshot: ₹1,600.00 on 2026-07-09 (chart frozen at publication)
Fundamentals & business context
Fundamentally, BHARTIHEXA presents a mixed picture. With a PE of 43.9, the stock appears richly valued, especially considering its profit margin of 18.5%. However, its revenue CAGR of 12.4% and profit CAGR of 46.7% over the past 5 years suggest robust growth, which could justify the valuation. The 10.7% institutional ownership indicates a cautious approach by institutional investors, possibly reflecting the stock’s valuation or the sector’s volatility. There’s no NSE catalyst today, reinforcing the technical nature of the move.
Algorithmic scorecard
The algorithmic scorecard for BHARTIHEXA reflects a balanced view, with strong fundamental signals offset by weaker technical indicators. On the positive side, the stock’s 12.4% revenue CAGR and 46.7% profit CAGR over the past 5 years highlight its growth potential. Additionally, the 0.94 PEG ratio suggests the stock is undervalued relative to its growth, making it an attractive option for growth-oriented investors. On the flip side, the stock’s bearish trend, indicated by the 50-DMA below the 200-DMA, and its position near yearly lows within the 52-week range, signal caution. These technical weaknesses suggest that while the stock has growth potential, its current valuation and market position require careful consideration.
Company outlook
Looking ahead, management has outlined a stable capital expenditure plan for the coming year, with expectations to maintain capex levels similar to this year. This suggests a focus on sustaining growth without overextending financially. Additionally, there’s a positive note on dividend policy, with a progressive increase in dividend payouts expected for Bharti Hexacom. This outlook indicates a commitment to rewarding shareholders while maintaining a balanced approach to growth and financial health.
Get all details on BHARTIHEXA — P&L, peers, shareholding and more on TradeAlone.
BHARTIHEXA
Bharti Hexacom Limited Q4 FY26: Revenues Up 5.4% Yoy, Ebitda Margin at 54.4%
Bharti Hexacom Limited (BHARTIHEXA) reports Q4 FY26 results with revenues up 5.4% YoY, EBITDA margin at 54.4%.

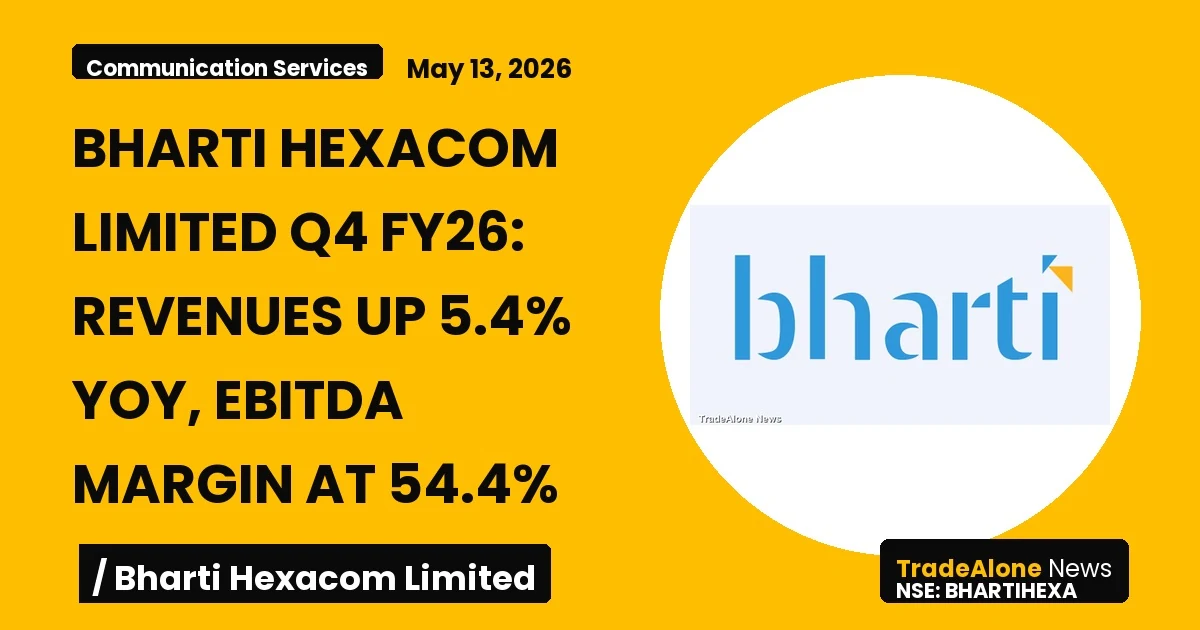
Bharti Hexacom Limited (BHARTIHEXA) announced its audited results for the fourth quarter ended March 31, 2026. The company reported revenues of Rs 2,414 crore, up 5.4% year-over-year (YoY) and 2.3% quarter-over-quarter (QoQ). EBITDA increased by 7.7% YoY to Rs 1,314 crore, with a margin of 54.4%. EBIT rose 9.0% YoY to Rs 738 crore, with a margin of 30.6%. Net income (before exceptional items) amounted to Rs 466 crore, a 22.5% increase compared to Q4 FY25.
Key Financial Highlights
The company’s mobile services revenues increased by 3.8% YoY, driven by an enhanced portfolio mix and high-value customer attraction. The Homes, Office, and Other services segment saw a strong revenue growth of 65.3% YoY, fueled by robust net customer additions and footprint expansion.
Customer Growth and Network Expansion
Bharti Hexacom’s smartphone data customer base expanded steadily, with 1.2 million new customers added over the past year, marking a 5.8% YoY increase. The company deployed 245 towers to expand its network and improve customer experience. The overall customer base stands at 29.62 million.
Looking Ahead
Bharti Hexacom continues to focus on disciplined execution and strategic growth, aiming to deliver sustained performance and value to its stakeholders.
Source: NSE Corporate Announcement
Fundamental & Technical Analysis of Bharti Hexacom Limited
Bharti Hexacom Limited belongs to the Communication Services › Telecom Services sector. Here’s a quick read on where the business and the stock stand today.
Bharti falls 13.3% over three months and has not found a floor yet. D/E of 1.64 is elevated. As a result, debt servicing will compress free cash flow in a high-rate environment. Revenue consistency is the one bright spot — zero dips in five years shows operational resilience. The stock sits at 4% of its 52-week range, close to annual lows. Historically, value investors build positions at these levels — though cheap stocks can stay cheap. Revenue grows at 16.5% and the stock moves sideways over three months. Neither side makes a strong case. The next earnings print will likely break this stock out of its current range. Check Fundamentals of Bharti Hexacom Limited.
-

 GAIL3 days ago
Gail (india) Limited Appoints Shri Manoj Kumar Sharma as Director (projects)
-

 Basic Materials3 days ago
Steel Authority of India Limited (sail) FY’27 Snapshot: Robust Financials and Production Metrics
-

 COFORGE2 days ago
Coforge Limited (NSE: Coforge) Expands Ai-powered Vehicle Lifecycle Intelligence Capabilities
-

 Apparel Manufacturing1 day ago
Iris Clothings Limited (irisdoreme) Expands Doreme’s Digital Footprint Through Amazon Partnership
-

 PREMIERENE1 day ago
Premier Energies Limited (premierene) Commissions India’s Largest Solar Cell Facility
-

 Information Technology Services1 day ago
Magellanic Cloud Limited (NSE: Mcloud) Enters AI Smart Fuel Infrastructure Market with Nayara Energy Contract
-
 BIOCON1 day ago
Biocon Limited (biocon) Pertuzumab Becomes First Biosimilar to Secure EMA CHMP Approval
-

 DBL1 day ago
Dilip Buildcon Limited (DBL) Sells Stake in Under-construction Solar Portfolio to Alpha Alternatives