
Market ABC
Spotting an operator game: How to do it?
What is price action?
Before we learn to spot an operator presence in price action, let us see what is price action. Price action in general terms is how the price of a stock moves against time. In other words, the price of a stock is plotted against time. A stock’s price action can be visualized through a chart which forms the basis of technical analysis. Before we go into the details of price action trading we can list the trading types of trading carried out in the stock market. They are:
- Trading based on human emotions- This includes various biases such as loss aversion bias, confirmation bias, revenge trading, anxiety trading, and much more. In this type of trading the traders trade based on their emotions.
- Trading based on indicators – Most traders use indicators while trading, which shows the direction in which the market moves based on various backend mathematical calculations. Commonly used indicators are RSI, MACD, Bollinger bands, moving averages, stochastic RSI, and much more. The traders wait for the buy and sell signals and can find out trend reversals to occur from which the trader benefits from the market.
- Trading based on price actions- By using price action trading, the trader uses the price movements to enter and exit the trade rather than using indicators. While using this method, the trader neglects the fundamentals from analysis and only considers the relation between prices at various points in time.
Price action in detail
The price action typically involves an open-high-low-close chart (OHLC) or candle-stick chart in trading. The trader monitors any changes in the size, shape, position, and growth of these patterns.
Let us take a real-time example of a company’s stock movement to understand how price action works.

We have taken the above chart. Before using the price action of a stock, we need to determine the demand and supply zone of the market. In the chart above the lower red line indicate the demand market and the upper blue line indicate the supply market.

After establishing the demand and supply zones, the chart is predicted for supports and resistances. There are more supports and resistances in the chart, and we can find that a trend is formed. A trader has to analyze the past and present trends and look out for any repetitive strand formation.
When the stock price breaks out from the trend the trader can anticipate trend reversal and place buy/sell calls accordingly. This movement of price of the stock against time is known as price action.
When this price action is applied in combination with technical indicators, the probability of making profits is higher and more accurate.
Who is an operator in the stock market?

The stock market is built by prominent market participants. It includes retail traders/investors, institutional traders/investors, FIIs, and DIIs. Among the market participants, operators can be either individual investors or institutional investors, hedge funds, or a group of retail investors. As we saw, price action is a way of trading depending on the demand/supply in the market, and the price movements. So operators are market participants who can control the movement and direction of a trading market. We will see the characteristics of an operator.
- Operators are individuals or entities with huge financial back-up. They may be institutional investors or individual investors with huge funds to trade.
- Operators are market participants who possess the capacity to change the price movement/market direction with extensive buying or selling.
- Operators can manipulate the market by buying a wide-spread range of stock, thus increasing the price of the stock inorganically and then selling them extensively so that the prices hit rock bottom. When the prices reach their lowest the operators use the opportunity to invest again and profit from price gain later.
- Operators create a panic situation in the market and increase market volatility.
- Operators hold more information about the stock such as insider details and the deals the company will sign off compared to a retail investor.
What is an operator game?
Operator’s game is a common term used among traders and indicates different ways an operator can manipulate the market. We will see how to spot an operator’s game.
- When we see the volume of a particular stock, we can see they belong to the high-traded volume category. In such cases that stock seems attractive for investment without knowing the back scene.
- When we analyze the market depth of stock, we can see more percentage of sell quantity compared to buy quantity. It may be because the operators are playing their game. The operator will set a sell order in extensive quantity which may be a limit order. Seeing that the retail inventory thinks the market is bearish and begins panic selling. After the market becomes more bearish, the operator takes charge by buying those low-price stocks.
- Operators will target penny stocks more compared to other stocks. The reason is they are easy to buy and are highly volatile. Let us see few penny stocks and their volume.
| Company name | LTP | Volume |
| Suumaya industries limited | 8.55 | 341273 |
| DIL | 11.2 | 18449673 |
| Kanani industries | 7.45 | 23205 |
| Alok industries | 15.3 | 964 |
So an operator will buy penny stock in huge quantities, and wait for the price to increase every day. Once he attains his anticipated growth, he sells. In such cases, other retail investors incur losses as they will think the stock is growing at a good rate but doesn’t know the mastermind behind it.
How to be careful with the operator’s manipulation?
- Performing proper research before investing will eliminate most of the risks with trading. Though a trader uses price action and technical indicators to trade, a swift analysis helps with major losses.
- Track the price action for any abnormally huge trade numbers or look out for dramatic increases/decreases in price action. In such cases hold the trading for a specific time.
- Concentrating on long-term investment and avoiding short bets will avoid emotional trading by traders and enable clear thinking when there is an operator game.
- Zerodha in a blog mentioned that the operators start placing small amounts of buy calls and prices start moving up incrementally. This acceleration is also fuelled by the news, the buzz in the news, social media, etc. As soon as the price reaches a level, these operators sell the penny stocks causing the prices to gall without any intimation or warning.
- Traders also have to be careful about social media news and have to double-check before falling for it.
Yes, the operator’s game controls the market at times, but thinking beyond making money instantly and focusing more on long-term investments can save the trader from falling for false buzz and eliminate the operator’s manipulated tricks.


While it’s commonly acknowledged that there’s no foolproof strategy for purchasing stocks or investments, it’s often overlooked that selling a stock is an equally formidable challenge. Successful exits demand meticulous research, careful consideration, and a touch of serendipity to secure a profitable position. The commencement of your exit strategy occurs from the very moment you invest, especially when thorough research grounds it, and a rationale promising growth potential underpins it.
Consider this scenario: you’ve acquired shares in XYZ Motors Limited, enticed by their substantial investment in electric vehicles, with an initial purchase price of 400 INR. Now, with the stock soaring to 1000 INR, exiting necessitates assessing various factors, notably whether the share price has reached its full growth potential. Setting aside the preamble, let’s proceed with a few key considerations to bear in mind. It’s important to note that this article predominantly delves into a company’s fundamentals, omitting technical aspects. It’s also worth emphasizing that perfection in strategy is elusive in the stock market; success is the outcome of persistent evaluation, analysis, and unwavering patience. Lastly, there might be 1000 different perspectives associated with exiting from stock investment, but in this article, we’ll delve into 4 as listed below
1. Investment goals to determine the right stocks:
• These are targets for how much money to save and how to invest it to cover a variety of future expenses. It could be saving for a new vehicle purchase or retirement, or starting a child’s college fund. Goals are typically set to be achieved within a certain time frame. (TITAN,2022)
• Investment goal plays a huge role in determining the period and the riskiness of your investment. To illustrate, a person buying a house would prefer going into long-term investments like SIPs. A young 19-year-old whose main goal is to direct his pocket money in the most efficient way possible might find peace in equity investments.
• Riskiness can also be denoted as a function of investment goals, age, and many times income.
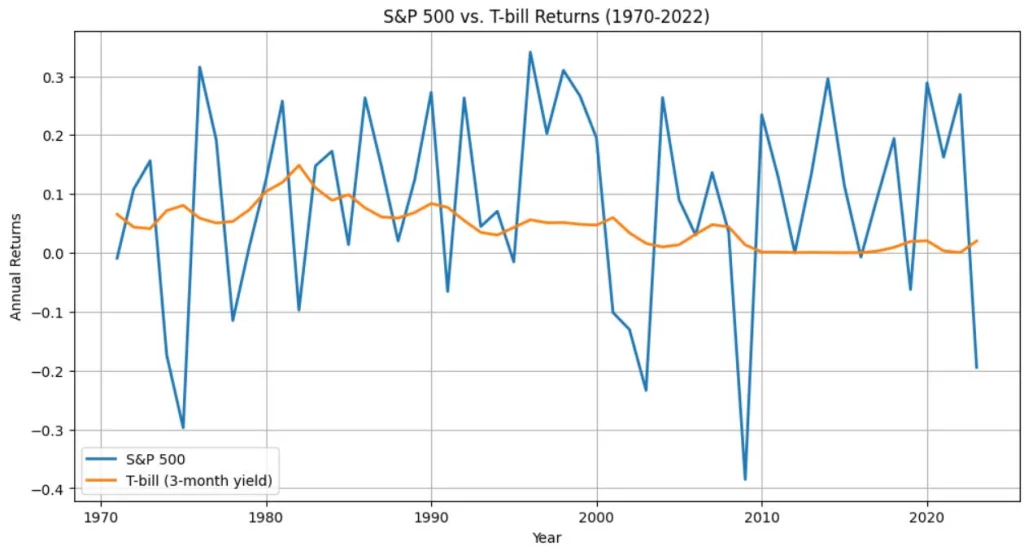
• Risk tolerance is the level of risk an investor is willing to take for each investment. Some investors will forgo a significant rate of return to achieve lower risk. For example, U.S. Treasuries are considered risk-free assets as long as they’re held until their maturity or expiration date.
In return, investors are paid a rate of interest. (BEATTIE, 2022)
Now, if we keep on ranting over Investment goals, it would take me another 30 pages to finish just that article, I’ll list a few articles for one to understand the essence of investment goals.
https://www.titan.com/articles/how-to-define-your-investment-goalshttps://www.investopedia.com/managing-wealth/basic-investment-objectives/https://www.investopedia.com/investing/figure-out-your-investment-goals/
2. Fact Finding for stock analysis:
• In the realm of stock and equity investments, one critical aspect is fact-finding. In the hypothetical scenario based on your research (fact-finding) you base your stock purchases on a company’s strategic moves it’s critical to assess how long it will take for these moves to reflect in its share price.
• Take, for instance, the scenario we discussed earlier: an entity, like XYZ Motors Limited, investing heavily in electric vehicles and holding a 30% market share. When all these elements align, you don’t just anticipate or expect a short-term share price boost. This investment serves as a catalyst, propelling the company forward in both the immediate and long term.
• The company’s alignment with industry trends and sustainability, along with its substantial market control, ensures that the investment not only has a positive immediate impact but also secures a promising future. It effectively addresses evolving market demands, safeguarding and potentially enhancing profitability.
• This insight is an imperative component of our exploration into the timing of exiting stock and equity investments. It emphasizes the significance of thorough fact-finding while making investment choices, allowing your investments to adapt and prosper harmoniously with the constantly changing market landscape.
Case Study:
If we take a real-time example rather than the made-up XYZ Motors Limited, we come across a similar situation in the case of Tata Motors. Tata Motors announced an investment of over $2 billion in its electric vehicle (EV) business over the next five years on October 13, 2021, following a fundraising event with private equity firm TPG. Tata Motors is now the market leader in India’s electric vehicle (EV) industry because of its substantial investment in EVs. With 34,000 EVs sold as of the first half of 2023, Tata Motors held a 72% market share. This is within the framework of a market that grew by 137% year over year, with 48,000 EVs sold, or 2.4% of all vehicles sold in India during that time.
3. Fundamentals for stock selection:
• The fundamentals of a company refer to the key financial and operational aspects that underpin its performance and value. These fundamentals are used by investors and analysts to evaluate the overall health and potential of a company. Some of the key fundamentals include Revenue, Profitability, cash flow, Debt to Equity, EPS, and Market Capitalization.
• In some cases, there may be situations where the company’s fundamentals start declining. This is when investors should consider reducing the allocation of that stock in their portfolio.
Case Study:
Yes Bank serves as a real-life example of a bank that faced deteriorating fundamentals. The loan portfolio of Yes Bank started to decline due, to an increase in non-performing assets indicating issues with credit quality. As a result of these worsening fundamentals, the Reserve Bank of India (RBI) took control of Yes Bank in March 2020. The RBI implemented a “moratorium” on the bank placing limits on withdrawals and announcing a restructuring plan. This caused concern among depositors. This led to a drop in Yes Bank’s stock price and Investors who held onto Yes Bank stock without taking any notice of its fundamentals would have experienced losses while those who acted quickly could have potentially minimized their losses.

4. Diversification of stocks: refers to the practice of spreading your investments across a range of stocks or securities. This strategy aims to reduce risk and potentially increase returns. It’s a principle, in investment and risk management emphasizing the importance of not putting all your eggs in one basket. When building your stock portfolio, it’s advisable to choose stocks, from industries, sectors, and geographic regions. By doing you can help minimize the risk associated with any industry or market segment underperforming. Now, how is it relevant with respect to selling the stock, usually experienced investors prefer allocating only a certain section of their portfolio to a specific sector keeping in mind the market conditions and trends.
What would a diversified portfolio look like?
➢ Reliance Industries Ltd. (RELIANCE) is a major Indian company that operates in the detail, telecommunications, petrochemical, and refining sectors.
➢ Information technology consulting and services are offered by Infosys Ltd (INFY), a large-cap Indian multinational company.
➢ Known for its financial services, HDFC Bank Ltd. (HDFCBANK) is one of India’s biggest private sector banks.
➢ India’s Tata Motors Ltd. (TATAMOTORS) is a manufacturer of automobiles that also makes commercial vehicles.
➢ Offering a variety of financial services, ICICI Bank Ltd. (ICICIBANK) is another well-known private sector bank in India.
➢ Hindustan Unilever Ltd (HINDUNILVR) an indian consumer goods manufacturer offering a large selection of personal care and household goods.
Disclaimer: Tradealone is using the above-mentioned portfolio as an illustration to describe the previous assertion and does not intend to suggest anything.
Both investing and exiting are based on personal value judgments which one perfects with consistent research to understand the workings of the market. There was never a shortcut to getting rich and profiting every time.
Thank you
Login to continue.
Login
Before we discuss D-link, let us see the three important factors that can be used to determine the target price of the stock are
- Future performance of the company
- Fundamental analysis
- Technical analysis
Future demand-supply for the company
D-Link is a global leader connecting people, businesses, and cities with computer networking solutions and technology. The company provides various consumer utility products such as routers, switches, wireless access points, controllers, adapters, cameras, and cloud services.
The router and switch market size was valued at US$ 50.50 billion in 2022. It is expected to grow at a CAGR of 6.3% from 2023 to 2030. As more companies shift to digital technology, the demand for network connectivity will improve drastically. After Covid, when most companies started connecting from home, efficient network connectivity was in demand highly. 5G technology, cloud computing, and Internet-of-things have majorly contributed to networking growth. Also, e-commerce websites from food to retail shopping to grocery shopping are expected to fuel the rapid growth of networking technology around the globe.
So, Yes D-Link and other networking companies are expected to showcase remunerative growth in the following years.
Fundamental analysis of D-link
- The revenue has grown by 29% in FY23 as compared to FY22.
- The net profit saw a drastic increase to Rs.86 Crore, compared to Rs.42 Crore in 2022.
- Very strong annual TTM EPS growth rate
- Effectively increasing RoE as it is using the shareholder’s fund efficiently.
- The company has zero debt
- The company is also using the capital efficiently as we can see a good increase in ROCE compared to previous years
- The PE is 9.6, which indicates the undervaluedness of the stock.
- The stock is highly volatile with a beta of 1.76 and we can see more prominent investors selling the stock recently.
Technical analysis of D-Link
RSI is the relative strength index indicator, which is a momentum indicator used in the technical analysis of stocks. An RSI value of above 30 indicates oversold and above 70 indicates overbought. Let us see where the RSI stands for D-Link

The volume of the stock when it was closing on Friday 28-07-23 was at 475.675K, which was at 707.903K on Thursday and was at 1.317M When the stock was closing last week Friday.
The stock is giving a return of 20% in the last 1 month and 86% in the last 1 year. The company also reached its 52-week high in the past 7 days.
The quarterly results ending June 2023 were made available. The company’s revenue fell by 4% quarter to the quarter ending 30-jun-23. Consolidated PAT increased by 4% using the same period. However total revenue increased by 2% YoY and PAT increases by 29% during the same period. The stock was trading at Rs.309.05/share when it closed on Friday, but anticipating the Q1 results the price target is set for Rs.315/share in the upcoming week. Dopwnside the stock can trade at Rs.298/share.
Visit here to read the comprehensive analysis of D-Link
Introduction
The two leading stock exchanges in India are the National Stock Exchange (NSE) and the Bombay Stock Exchange (BSE), both of which are essential to the financial system of the nation. Despite having the same objective of giving investors a transparent and effective platform, they are different in a number of ways.
Historical Background
Asia’s oldest stock exchange, the Bombay Stock Exchange (BSE), has a distinguished history of defining India’s financial environment for more than a century, whereas NSE has been new in the picture.
BSE
The BSE, which was established in 1875 has a long and storied history, started off using an open outcry method, in which traders transacted directly with one another on the trading floor.
It has embraced modernisation and technical development over time, switching to screen-based electronic trading in the early 1990s.
NSE
The NSE, founded in 1992, entered the picture as a rival to the BSE’s hegemony. The NSE established electronic trading in India as a pioneer, driven by a mission to promote efficiency, transparency, and investor safety.
It revolutionised trading by switching to a fully automated platform, which decreased settlement times and did away with the necessity for physical trading floors.
Ownership and Structure
The National Stock Exchange (NSE) and the Bombay Stock Exchange (BSE) differ fundamentally from one another in terms of ownership and structure
BSE
The BSE, operates as a mutual organisation, and brokers are also stockholders in the exchange. Brokers participate actively in the governance of the BSE and have a stake in its performance as shareholders.

This model guarantees a strong sense of ownership and aligns interests, but it may also result in a more focused decision-making process that primarily represents the goals and perspectives of broker-shareholders.
NSE
The NSE is a shareholder-owned company that is owned by a number of banks, financial institutions, and other market participants. It enables participants from various financial sector segments to influence the exchange’s operations, rules, and long-term goals.
As a result, the NSE’s decision-making process frequently exhibits a wider variety of viewpoints since shareholders with different interests work together to find common ground on important issues.
Trading Mechanisms
The BSE and NSE both are technically strong, but they have their own differences in this field too. Their trading systems, however, reveal their various approaches to embracing technology.
BSE
The BSE began with an open outcry system, where dealers gathered in person on the trading floor to carry out transactions by shouting out bids and offers. In 1995, it started using the BSE On-Line Trading (BOLT) system.
The BSE improved its accessibility and efficiency using BOLT, attracting a wider spectrum of investors and assuring smooth order matching and execution.
NSE
The National Exchange for Automated Trading (NEAT) technology, developed by the NSE, is notable for revolutionising the Indian stock markets. It launched the NEAT portal in 1994.
The NSE’s NEAT system increased trading volumes by eliminating delays brought on by conventional open outcry procedures and a significant reduction in trading time.
Indices
Both the Bombay Stock Exchange (BSE) and the National Stock Exchange (NSE) provide well-known stock market indices that act as important benchmarks for monitoring India’s equities markets. Still, they hold on to their differences in this area too.
BSE
The Sensex is an established index and is one of India’s first equity indices. The 30 largest and busiest BSE listed companies make up this group. The performance of the Sensex, which both market participants and the media extensively follow, is frequently used as a gauge of the Indian stock market.
It consists of businesses from many industries, and its makeup is reevaluated on a regular basis to make sure it still reflects current market realities.
NSE
The 50 most liquid and actively traded stocks listed on the NSE make up the diversified index known as the “Nifty 50.” It is intended to accurately reflect the entire market performance and represents numerous economic sectors.
The selection criteria for the Nifty take into account variables including liquidity, market size, and trading volume to make sure the selected stocks are indicative of the NSE’s larger market.
Product Offerings
Although both stock exchanges enable equities trading, they focus differently on other financial instruments.
BSE
The BSE offers derivatives trading but has historically placed a greater emphasis on debt securities and mutual funds. Bonds, government securities, and other fixed-income instruments can all be traded by investors on the BSE, which has been an important marketplace for debt securities.
Additionally, by giving investors a venue to readily acquire and sell mutual fund units, the exchange has contributed to the promotion of mutual fund investing. Investors looking for more secure and predictable investment options in the Indian market will benefit from the focus on debt instruments and mutual funds.
NSE
The NSE has paved the way for the promotion and acceptance of derivatives trading in India. It provides a broad selection of derivative products, such as futures and options contracts on a range of underlying assets, including stocks, indices like the Nifty 50, and commodities. These derivatives give investors the chance to protect their positions, make predictions about price changes, and improve trading methods.
The NSE’s introduction of currency derivatives, such as currency futures and options, also significantly impacted the development of a thriving currency trading market in the nation. This increased the financial environment’s diversity and drew individuals interested in exposure to foreign exchange.
| S.No | Basis | BSE | NSE |
| 1 | Historical background | established in 1875, with open outcry method | established in 1992, with technically-abled system |
| 2 | Ownership and Structure | operates as mutual organisation | Shareholder- owned company |
| 3 | Trading mechanisms | Uses BSE On-Line Trading BOLT System | uses NEAT portal |
| 4 | Indices | Sensex | Nifty 50 |
| 5 | Product offerings | Bonds, government securities etc. | Stocks, Nifty 50, etc. |
Conclusion
BSE and NSE, both diverse in a variety of ways because to differences in their histories, ownership, trading methods, etc. Despite these differences, both stock exchanges have the same objective: to give investors a forum to engage with the Indian economy and take advantage of its growing potential. NSE and BSE will continue to be significant engines of investment and economic growth as India’s economy changes.
Follow us at TradeAlone.com to stay updated with the latest market news.
-
 Profit Making Idea1 year ago
The Grandfather Son (GFS) Strategy: A Technical Analysis Trading Strategy
-

 Uncategorized8 months ago
A BJP victory and the Stock Market: what to expect this monday
-

 Technology5 months ago
Innovative Metro Ticketing Revolution in Pune by Route Mobile and Billeasy’s RCS Messaging. Stock trades flat
-
 editor9 months ago
How to research for Multibagger Stocks
-
 Trending12 months ago
Does the “Tata-Apple venture” benefit Tata shares?
-
 Finance World12 months ago
How Zomato Turned Profitable: A Landmark Achievement in the Indian Food Delivery Market
-
 Market ABC1 year ago
The Pullback Strategy: A Timeless Approach to Investment Success
-
 Finance World10 months ago
Dmart VS Walmart – Business Model of Retail Giants