
Stock Analysis
Stochastic Indicator: A Fundamental Guide
Introduction
The world of financial markets relies heavily on technical analysis. Traders and Investors use different tools to forecast future price fluctuations. The stochastic indicator is one such tool that provides insightful information about market momentum and overbought or oversold positions. We will go into the stochastic indicator in this post, looking at its definition, operation, and actual use.
Click here for more of Trading indicators.
Defining Stochastic indicator
Likewise RSI and ROC, Stochastic indicator is also a Momentum oscillator indicator. This means that the value of Stochastic indicator oscillates within a range from 0 to 100. This indicator mainly deals with the range at which the price is changing.
The stochastic indicator is a popular technical analysis tool that helps traders assess price momentum and spot probable overbought or oversold market scenarios. George C. Lane created it in the late 1950s, and because of its success in foretelling market reversals and trend continuations, it has become a crucial component of traders’ toolkits.
The stochastic oscillator contrasts an asset’s current price with its price range over a predetermined time, often 14 period, This means that Stochastic indicator looks back at the price movement for the last 14 periods and compares the same with the current price to produce a number between 0 and 100. This value represents the asset’s closing price position about the price range. This reading gives traders an important indication, suggesting possible market-turning moments or the continuance of current trends.
Let’s try to understand how exactly does the scochastic indicator help in figuring out the buy/sell points?
The functioning of the indicator
The stochastic indicator is based on the idea that prices often close near the high during an uptrend and near the low during a decline. Well, this makes sense as well, imagine a share which makes a high but does not close anywhere near to it. This will give an indication that not many people are willing to buy the stock at high but rather are looking to book their profits. Similarly, for a stock in downtrend if its closing is higher than the daily low consistently, this could also mean that the stock is just about to bottom out as there are less sellers every time it hits a low.
Interestingly, unlike majority of the indicators, there are two lines in stochastic indicator: %K and %D. The location of the current closing price inside the price range is represented by %K, and %D is a moving average of %K.
How to calculate the value of K and D?
There are three basic steps in the calculation:
%K = (Current Closing Price – Lowest Low) / (Highest High – Lowest Low) * 100
A three-period moving average of %K is commonly used to calculate %D, which is a moving average of %K. The %K line’s oscillations are smoothed out by this moving average, which gives a more realistic picture of the asset’s momentum.
So, now we understand that this indicator follows two lines, one of which speaks about the current closing price with respect to the lowest low price in the period of consideration and also the price range for the same period. From the above formula denominator, you can see that if the range of price movement is high, ie – (Highest high – Lowest low) this would make the denominator high and so the %K value will reduce. Similarly, if the difference of current closing price and lowest low of the stock for the considering period is high, this would make the numerator high and thus the value of Indicator will go up.
%D or the other line is merely a line to show the moving average of the %K line.
Usage of the Stochastic Indicator in Practice
Traders use the stochastic indicator in various ways to improve their trading methods. Following are a few typical applications:
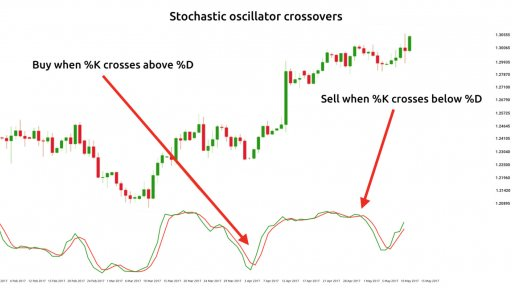
What does it mean when we say “Buy when %K crosses above %D”?
This means that the %D line which is a moving average of %K has been overshadowed by the current %D line plotting. This could also be understood as its the time when the %K line is gaining momentum when compared to its past movement.
Recognizing overbought and oversold conditions:
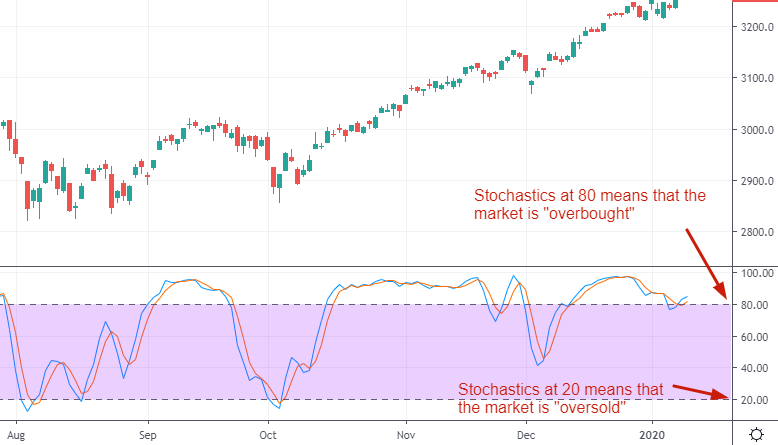
By observing the stochastic indicator, traders may tell when an item is trading at extreme levels. They can foresee probable price reversals or corrections thanks to this knowledge. By Default when the lines cross 80 point barrier we call it a overbought position. Similarly, when the Stochastic indicator lines fall below 20, we call it a oversold situation. Lets try to understand it with some example. Ie- for the value to move past 80, this would mean that the (Numerator/ Denominator)*100 is 80.
From the formula above – (Current Closing Price – Lowest Low) / (Highest High – Lowest Low), this means that the (Current Closing Price – Lowest Low) is 0.8 times of (Highest High – Lowest Low). This also means that the current closing price is almost at par with the highest high ( 80% of it).
This also means that if the closing price is the highest price and the indicator %K line will hit 100 value and the stock could potentially see a profit booking.
Divergence analysis:

Traders look for deviations between price movement and the stochastic indicator to identify probable trend reversals. Divergence for any trading indicator means when the stock price and the indicator line moves in the different direction. You can read our blog to understand what does it actually mean when we say a divergence has taken place.
Divergence here Indicates a prospective upward price movement, a bullish divergence happens when the price makes a lower low while the stochastic indicator makes a higher low. In contrast, bearish divergence happens when the stochastic indicator makes a lower high while the price makes a higher high, indicating a likely downward price movement.
Limitations of the indicator
The stochastic indicator has some drawbacks despite being a helpful tool. Depending on the asset being studied and the state of the markets, its accuracy can change. It might produce false signals in trending markets, resulting in losses. The indicator may also generate erratic and choppy readings during low volatility or when markets are range-bound. Traders frequently use the indicator with other technical analysis tools and indicators to overcome these drawbacks. The stochastic oscillator can increase the precision of trading signals and enhance overall decision-making when combined with trendlines, moving averages, or support and resistance levels.
Conclusion
A popular technical analysis tool, the provides useful insights into market dynamics and probable overbought or oversold positions. It has become a crucial part of traders’ toolkits, allowing them to generate buy and sell signals, assess divergences. Thus make educated decisions on entry and exit points.
Unlock exclusive content, stay informed, and sign up with TradeAlone!


In today’s dynamic stock market, sustainability has become a key factor for investors seeking long-term growth opportunities. One company that has recently garnered attention for its sustainability efforts is Himadri Speciality Chemical Ltd. In this blog, we’ll explore why investing in Himadri can be a wise choice for those looking to align their portfolios with sustainability goals.
About Himadri Speciality Chemical Ltd
Himadri Speciality Chemical Ltd is a prominent player in the speciality chemical industry. They focus on research and development (R&D), innovation, and sustainability. The company is a pioneer in the production of lithium-ion battery materials in India. They constantly innovate raw materials for the lithium-ion battery value chain. Their diverse product range includes speciality carbon black, coal tar pitch, refined naphthalene, advanced materials, and more. Himadri serves various sectors such as lithium-ion batteries, paints, plastics, tires, aluminum, graphite electrodes, agrochemicals, defense, and construction chemicals.
Himadri operates both domestically and internationally. They export their products to 49 countries worldwide. The company’s strong commitment to sustainability is evident through its eight zero-liquid discharge manufacturing facilities. Additionally, they extensively use in-house clean power, covering over 90% of their energy needs. These initiatives highlight Himadri’s dedication to reducing its environmental footprint while maintaining robust business operations.
Himadri’s EcoVadis Silver Medal
In 2023, Himadri Speciality Chemical Ltd achieved the prestigious Silver Medal from EcoVadis, a globally recognized agency for business sustainability ratings. This achievement signifies Himadri’s unwavering commitment to sustainability across crucial pillars. These pillars include governance/ethics, environment, labor and human rights, and sustainable procurement.
Stock has grown over 3.5 times over the past 12 months. The rally still looks intact. However, trading at around a PE of 43, investors should be careful.

This recognition places Himadri among the top 23% of companies evaluated by EcoVadis worldwide, a remarkable accomplishment considering that EcoVadis rates over 100,000 entities. Himadri’s commitment to sustainability extends to well-defined short-term and long-term objectives, each with specific timelines. The company is resolute in allocating the necessary resources—whether financial, technological, or research-driven—to meet these goals.
One noteworthy commitment is Himadri’s active pursuit of carbon neutrality by 2050. This aligns the company with global decarbonization objectives. These forward-thinking initiatives not only support environmental sustainability but also demonstrate the company’s readiness to embrace future regulatory changes and market demands.
Investing in Himadri for a Sustainable Future
Investing in Himadri Speciality Chemical Ltd presents an exciting opportunity for those seeking sustainable investment options. As the world shifts toward more environmentally conscious practices, companies like Himadri are well-positioned to thrive. With its strong focus on R&D and innovation, Himadri is poised to tap into emerging markets and technologies. This includes the growing demand for lithium-ion batteries and other sustainable products.
Furthermore, Himadri’s commitment to corporate governance, ethical boundaries, and alignment with the United Nations Global Compact and Sustainable Development Goals (SDGs) showcases its dedication to responsible and sustainable business practices. This commitment is not only reassuring for investors but also contributes positively to the global push for a more sustainable future.
Follow Tradealone for more news on chemical sector.
In conclusion, Himadri Speciality Chemical Ltd’s EcoVadis Silver Medal is a testament to the company’s sustainability efforts and its potential as an investment opportunity. By prioritizing sustainability and innovation, Himadri is not only making a positive impact on the industry but also paving the way for a greener and more prosperous future. Investors with an eye on the long term and a commitment to sustainability should keep a close watch on this promising company.
Hello Financial Wizards! Let’s Talk HDFC Bank’s Future
Hey there, savvy investors and finance enthusiasts! Today, let’s dive into a hot topic that’s been stirring up the investment community – the future of HDFC Bank. Can it really grow 100x in the next 20 years? Some say yes, while others, including a former banker, are raising their eyebrows. Let’s break this down together. 💬🔍
A $16 Trillion Dream: Is It Really Possible?
So, here’s the deal: HDFC Bank currently sits at a market cap of around $160 billion. There’s talk about it reaching a staggering $16 trillion in 20 years. Mind-blowing, right? But let’s not get carried away just yet. 🌌💸
The Banking Battlefield: It’s Tough Out There!
The banking sector is like a gladiator arena. It’s ultra-competitive, and banks have to constantly up their game to keep customers happy. If they don’t, there’s always another bank ready to swoop in. And let’s not forget the threats from neobanks, online banks, credit unions… you name it. 🛡️🏦
HDFC Bank vs. The World of Digital Banking
Facing the Future Head-On
HDFC Bank has been a juggernaut, no doubt. But the world of banking is changing at a breakneck pace. We’re talking about digital revolutions with neobanks and online banking platforms. These players are rewriting the rules, making it tough for traditional banks to keep up. 🌐🚀
The Numbers Game: ROCE and Growth
HDFC’s Return on Capital Employed (ROCE) is currently around 6-7%. Now, here’s a nugget of wisdom from Charlie Munger: a stock’s long-term returns roughly equal its ROCE. So, if the capital compounds at 6%, how can we expect a 25% CAGR in market cap? It’s a head-scratcher, isn’t it? 🤔💹
Leverage and Growth: A Double-Edged Sword
Sure, HDFC has a higher Return on Equity (RoE) at 18% thanks to leverage. And yes, it can grow faster than its ROCE. But even then, expecting it to grow at an old rate of 25% seems like a stretch, especially given its size. 📈⚖️
A Reality Check: Comparing Global Giants
The US Economy and JP Morgan
Let’s play a game of comparison. Imagine India in 20 years, matching today’s US economy. The biggest bank in the US, JP Morgan, is valued at around $500 billion, not even close to $1 trillion. So, expecting HDFC Bank to reach $16 trillion seems… well, a tad overoptimistic. 🇮🇳🇺🇸
The Big Picture: India’s GDP and HDFC Bank
Think about it – India’s GDP itself might hit $30 trillion in 20 years. So, picturing a single company, even HDFC Bank, at a $16 trillion market cap is, to put it mildly, a stretch. 🌍💰
Wrapping Up: What’s the Smart Move?
As much as we love rooting for our favorite stocks, it’s crucial to stay grounded. In a world rapidly embracing new tech, even the mighty can struggle to outperform. So, as you strategize your investments, remember – the future is about adaptability, innovation, and realistic expectations. 🚀🧠
And there you have it, folks! What do you think about HDFC Bank’s future? Is it a golden goose or a reality check waiting to happen? Drop your thoughts and let’s keep this conversation going! 💬📊
editor
Tata Technologies – Engineering a Better World and Stellar IPO Performance
tata technologies IPO
Engineering a Better World with Tata Technologies
Tata Technologies, an integral part of the esteemed Tata Group, stands as a transformative force in the engineering landscape, spearheading innovation at the dynamic crossroads of digital technology and traditional engineering. Specializing in pivotal industries such as automotive, aerospace, and industrial machinery, Tata Technologies assumes a critical role in the entire product development lifecycle. Tata Technologies just has a stellar IPO performance.
The company’s impact extends from the conceptualization phase, where groundbreaking ideas take shape, through the meticulous development process, and finally to the realization of cutting-edge products and experiences. Tata Technologies doesn’t merely contribute to technological advancement; it actively shapes a future where products are not only safer and more sustainable but also possess the transformative power to significantly enhance the quality of people’s lives.
Industries Tata Technologies is operating in:
In the automotive sector, Tata Technologies plays a crucial role in envisioning and creating vehicles that meet the evolving demands of the market. Whether it’s pioneering electric vehicles, enhancing safety features, or optimizing fuel efficiency, the company’s engineering prowess shines through.
In the aerospace industry, company takes flight by contributing to the development of innovative solutions that propel the sector forward. From designing state-of-the-art aircraft components to advancing aerospace technology, the company is at the forefront of progress.
In the realm of industrial heavy machinery, Tata Technologies leverages its expertise to engineer robust and efficient solutions. This involves developing machinery that not only meets industry standards but also incorporates the latest advancements in technology to enhance productivity and reliability.
Driving the Change:
As a trailblazer in the engineering domain, Tata Technologies not only adapts to change but actively drives it. Through a harmonious blend of digital innovation and traditional engineering principles, the company continues to inspire a new generation of engineers, fostering a spirit of creativity, collaboration, and excellence. In essence, Tata Technologies is not just a participant in the evolution of industries; it is a driving force behind the transformation of ideas into tangible, impactful realities.
Their approach goes beyond delivering discrete outcomes. Tata Technologies is a comprehensive partner for end-to-end product development, equipped with the experience and expertise to envision and materialize a better future. The company’s global presence brings together diverse teams with a variety of skill sets, collaborating in real-time to solve complex engineering problems. This collaborative effort is pivotal in redefining engineering and expanding its influence to address humanity’s most pressing challenges and opportunities.

Tata Technologies IPO: A Milestone Achievement
After 19 years, Tata Technologies, a gem in the Tata Group’s crown, celebrated a momentous milestone by going public. The IPO was met with overwhelming enthusiasm, reminiscent of the reception of TCS’s IPO, the last Tata Group company to go public.
- IPO Details: The IPO was priced at Rs 500, but it listed at an astonishing Rs 1200, translating to a premium of 140%! The current market price stands at around Rs 1250.
- Valuation: At the listing price of Rs 1200, the company commands a forward multiple of 67x (based on Rs 18 EPS) and a current PE of 72x.
- Comparison with TCS: TCS’s IPO in July 2004 had a price band of ₹775-900 and was listed at a 26.6% premium. Fast forward to Tata Technologies, the company received 73.57 Lakh applications for its IPO, a striking number that even surpasses the 73.37 Lakh applications for the colossal LIC IPO.
- Oversubscription: The IPO witnessed an oversubscription of 69 times, indicating the market’s strong confidence and elevated expectations for the company.
Celebrating the IPO Success
The IPO’s success story is not just about numbers; it’s a testament to Tata Technologies’ strong market position and promising future. A substantial profit of Rs 21,000 per lot had investors allotted shares celebrating, turning it into a highly successful listing event.
A Moment of Reflection
This remarkable journey of of the company and its astounding IPO performance brings a moment of reflection on the excitement and unpredictability of India’s IPO market. It’s a reminder of how applying for IPOs in such a dynamic market can sometimes feel like a lucky lottery.
Conclusion
Tata Technologies’ journey from engineering excellence to a stellar IPO is a narrative of innovation, growth, and market confidence. It’s a story that resonates with the Tata Group’s legacy and its ongoing commitment to shaping a better future through technology, engineering, and sustainable practices. However, there are still numerous high-potential stocks that are currently underperforming, and we recommend exploring these opportunities.
Disclaimer: This blog post is for informational purposes only and is not a recommendation or endorsement for any financial investment or strategy.
Check out some other potential multibaggers with Tradealone.
-
 Profit Making Idea1 year ago
The Grandfather Son (GFS) Strategy: A Technical Analysis Trading Strategy
-
 Uncategorized8 months ago
A BJP victory and the Stock Market: what to expect this monday
-

 Technology5 months ago
Innovative Metro Ticketing Revolution in Pune by Route Mobile and Billeasy’s RCS Messaging. Stock trades flat
-
 editor9 months ago
How to research for Multibagger Stocks
-
 Trending12 months ago
Does the “Tata-Apple venture” benefit Tata shares?
-
 Finance World12 months ago
How Zomato Turned Profitable: A Landmark Achievement in the Indian Food Delivery Market
-
 Market ABC8 months ago
Spotting an operator game: How to do it?
-
 Market ABC1 year ago
The Pullback Strategy: A Timeless Approach to Investment Success