
Market Basics
Breakout and How to Know if It Has Failed?
- Price action breakouts can present profitable trading opportunities, but not all breakouts are successful. To prevent potential losses, traders must be able to recognize when a breakout has failed
Hello readers, hope the markets are blessing you with profits. This article will cover how you can save yourself from significant losses due to false breakouts. So, buckle up!
What is a Breakout?
A price movement that significantly exceeds a predetermined level of support or resistance is referred to as a breakout. In simple words, it is a situation where the price of an asset moves beyond a level of support or resistance. This is usually observed with a significant increase in volume and signals a reversal in ongoing trends.
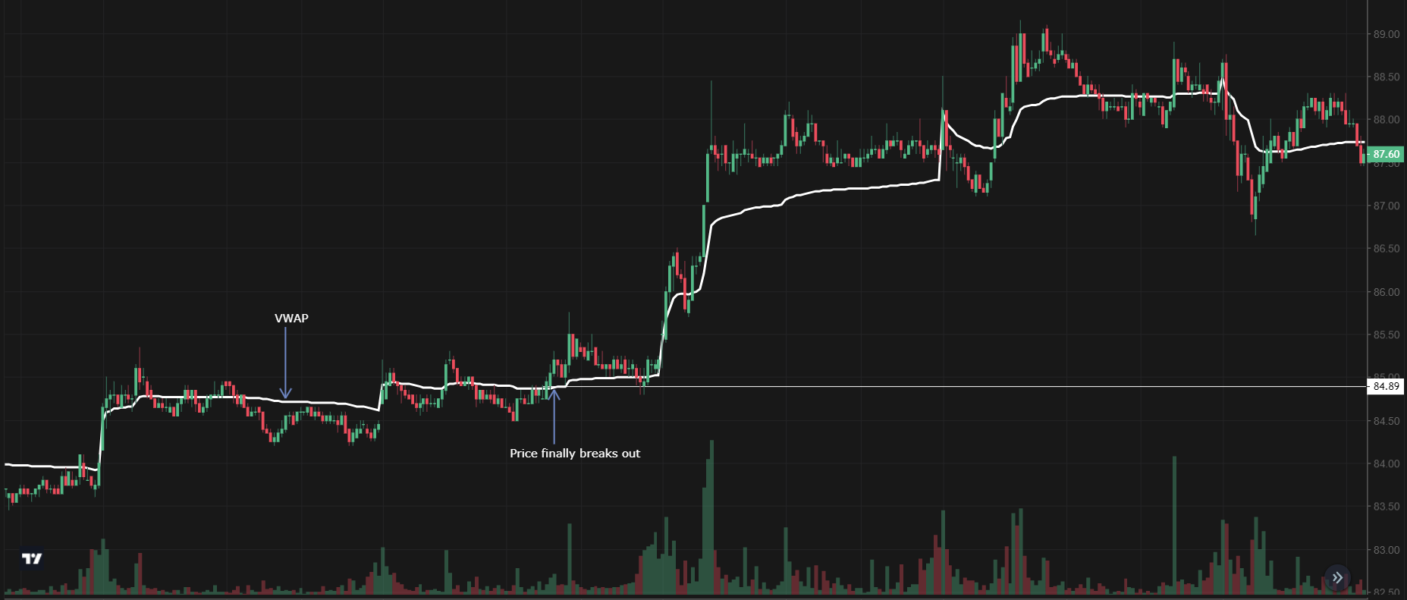
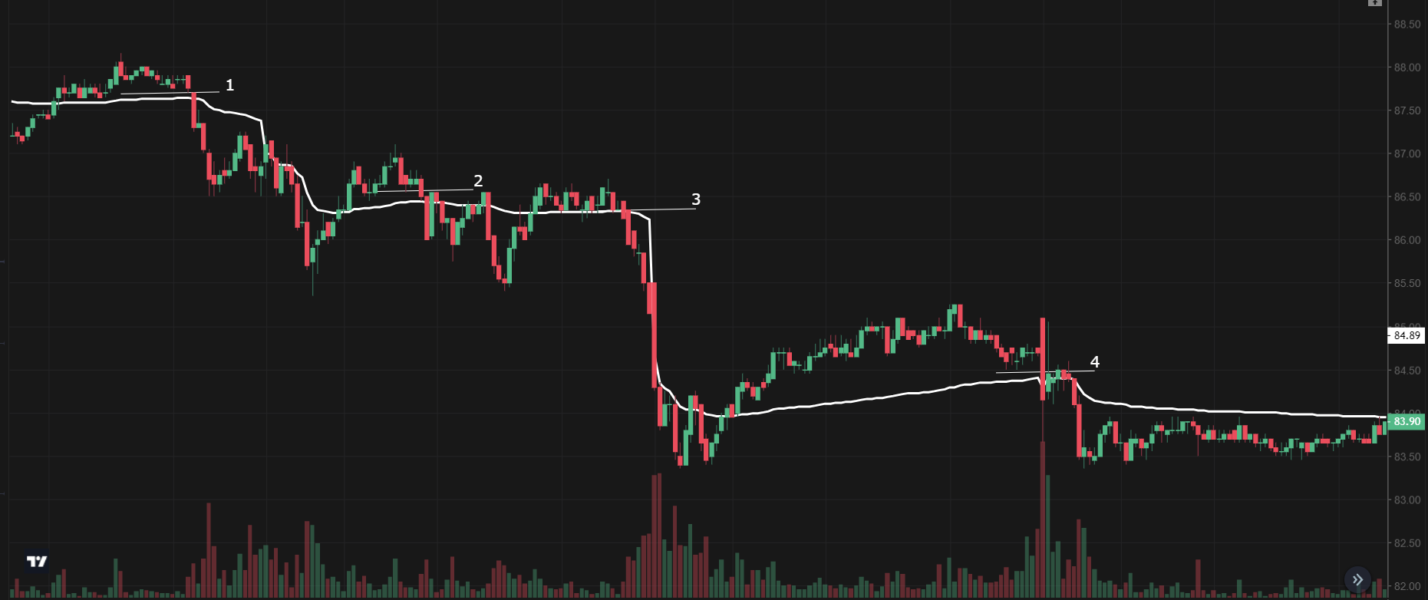
Support or resistance can be various areas or levels that the price struggles to surpass, such as VWAP, SMA 20, SMA 50, previous day high, previous day close, and trendlines. Numerous strategies focus on breakout trading around these levels. In the provided image, you can observe the price’s persistent attempts to breach the resistance level, identified as VWAP. After four unsuccessful tries, the price eventually broke through around 84.90. Following a brief retest, it continued to establish new highs, remaining comfortably above VWAP.
It is important to observe the contrasting volume levels during the failed attempts and the eventual breakout. When trading breakouts, remember that genuine ones coincide with a notable volume surge, indicating market strength and interest.
However, it is crucial to remember that not all breakouts are successful. To prevent potential losses, traders must be cautious in spotting real breakouts from fake ones.
False breakouts
A False breakout occurs when the price breaks out a level of support or resistance but fails to maintain the ongoing momentum. Such false moves can often lead to losses for traders who trade trend reversals. Multiple reasons can cause false breakouts including lack of buying/selling pressure, profit taking, change in market sentiment, or sometimes market manipulation.
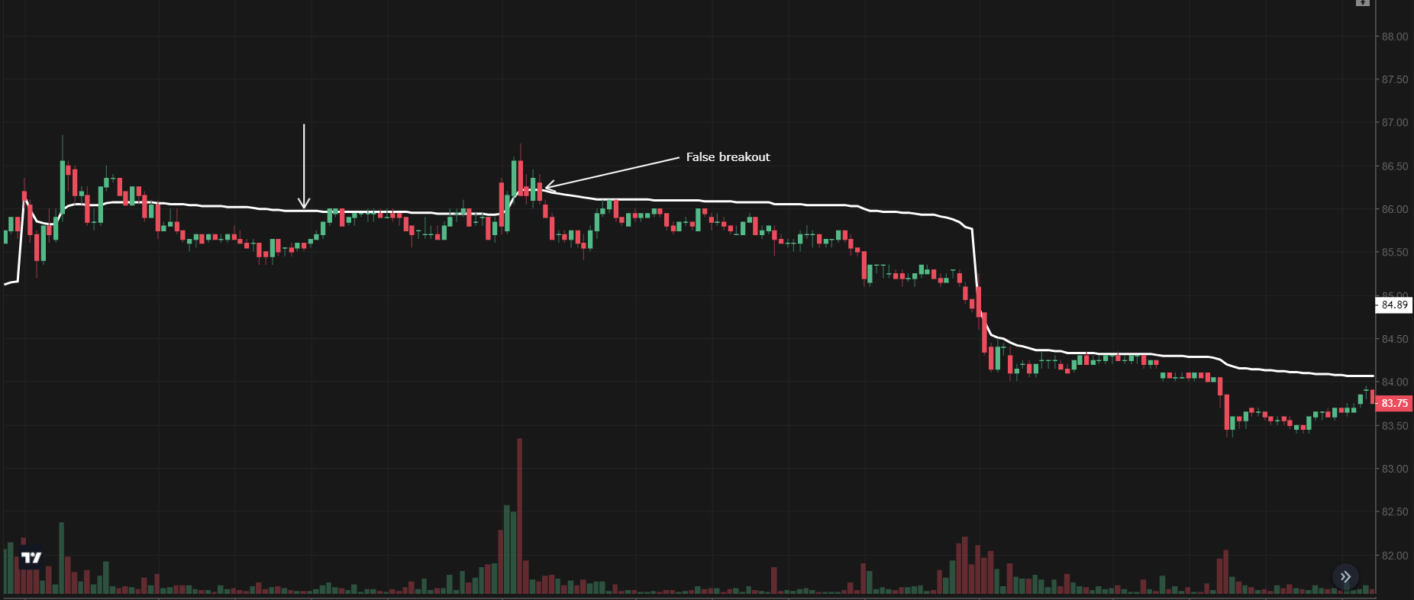
In this example, multiple attempts were made to break the resistance level (VWAP), but they all failed. Despite a significant increase in volume, the price remained below VWAP. On the fourth attempt, which appeared promising, it turned out to be a false breakout. Following this, the price continued to decline, reaching a bottom of around 83.40.
In such situations, indicators can be invaluable. A glance at MACD and RSI reveals waning momentum. The MACD line crossing below the signal line indicates bearishness. RSI confirms the weakening price strength and downward trend. Utilizing indicators in this way can help traders avoid potential losses and enhance their market analysis.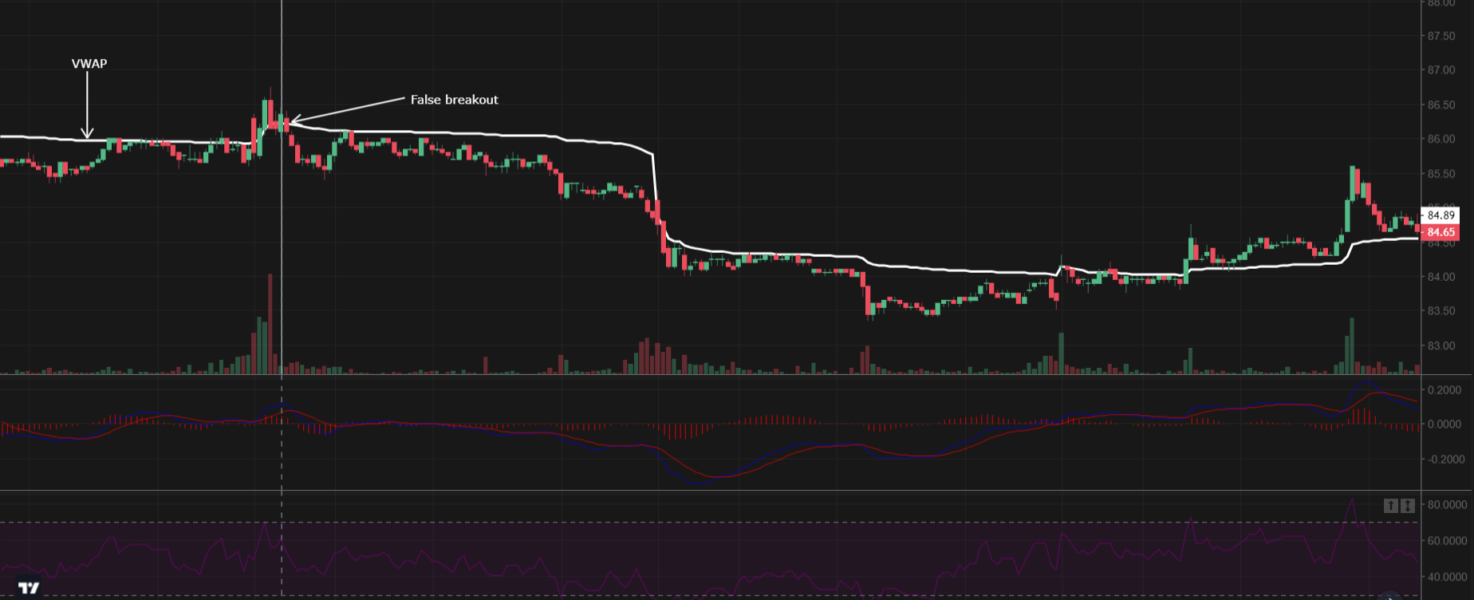
How to know if a breakout has failed?
- Unsustained volume– Volume is one of the most important indicators which can signal a false breakout. Valid breakouts are accompanied by significant volumes indicating buying/selling pressure. However, false breakouts lack volume which suggests a lack of interest from the market. Therefore, if a breakout is not accompanied by volume, it could be a potential failure.
Nevertheless, it is important to note that there will still be a distinction in volume before and after the price attempts to break support or resistance. In most cases, attempts are accompanied by relatively higher volumes. It is logical for the volume to be slightly higher even during a failed attempt, as it signifies the intention to challenge the support or resistance level. However, the key difference lies in the sustainability of the volume increase. It tends to decrease over subsequent failed attempts, indicating a lack of sustained bullish or bearish momentum.
Observe how each failed attempt is accompanied by a relatively higher volume, yet the volume consistently decreases.
- Failed Retest– Confirming price moves is an important part of trading. And retest is a method by which traders confirm the validity of a breakout. For a breakout to be valid, the price must not move back to the previous trading range. If it does, this inability to maintain the breakout level shows a lack of conviction in either the bullish or bearish outlook.
A slight pullback following a breakout is typical, often caused by profit-taking or short covering. However, this pullback is temporary, and the price should resume in the new trend’s direction. Failure to do so indicates a failed retest, resulting in the price continuing the previous trend, potentially moving higher or lower accordingly.
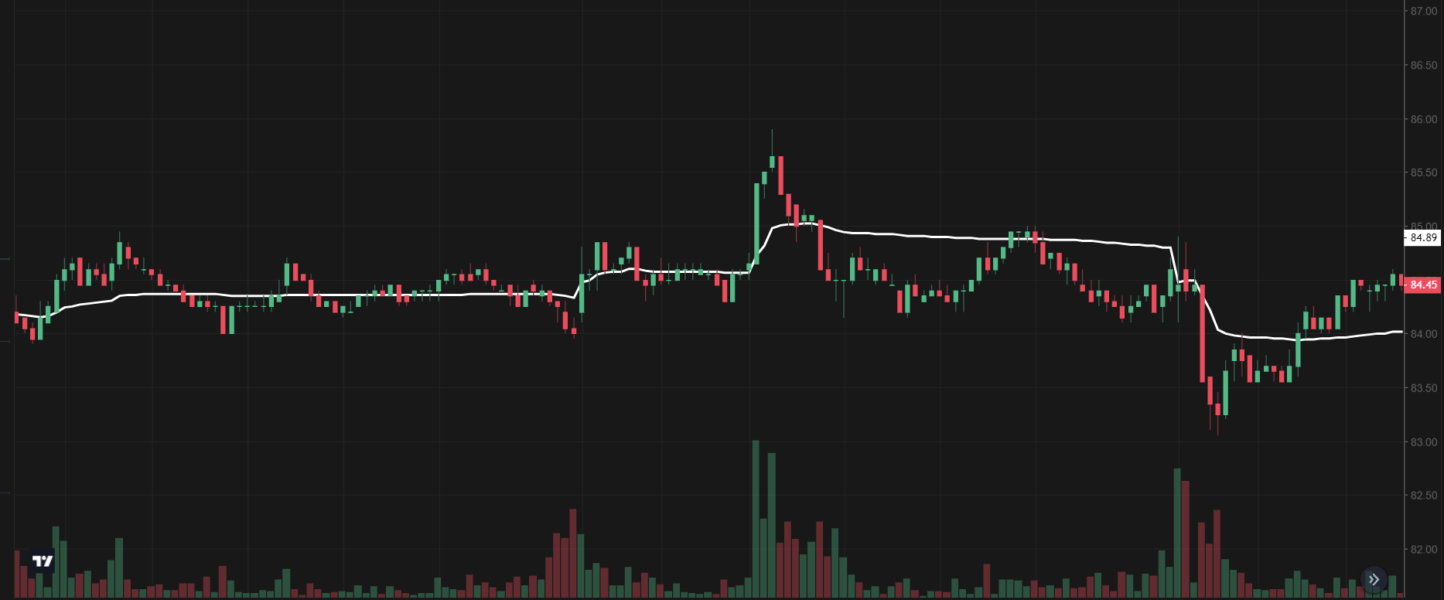
This example demonstrates four false breakouts, each accompanied by a failed retest. A valid retest requires the price to move higher and establish higher highs.
For traders looking to stay away from false signals and safeguard their capital, being able to spot a failed breakout is a crucial ability. False breakouts occur when the price momentarily breaches a level of support or resistance but fails to sustain the momentum. By considering key indicators such as volume and retests, traders can differentiate between genuine and false breakouts . Traders can make wiser decisions and modify their trading strategies by being aware of these key indicators. Remember, the ability to spot failed breakouts contributes to long-term profitability and successful trading endeavors.
That’s all for now, Happy trading!


Introduction
Due to the potential to significantly impact a company’s financial situation and outlook for the future, contingent liabilities are crucial in financial reporting. These liabilities are potential debts that could be owed due to past incidents but they are unsure whether they will come to pass due to upcoming circumstances. Because of their inherent uncertainty, companies must carefully evaluate how to recognize, assess, and disclose these commitments in their financial statements.
Understanding Contingent Liabilities
As prospective obligations depend on unforeseen future occurrences, contingent liabilities are crucial to financial reporting. The company defers the recording of these liabilities on the balance sheet as actual obligations until the occurrence of the triggering event is likely or inevitable.
Recognition and Measurement
To account for contingent liabilities, businesses follow accounting guidelines like Generally Accepted Accounting Principles (GAAP) or International Financial Reporting Standards (IFRS). Two important requirements must be met for contingent liabilities to be recognized:
- Probability
The business assesses the chance that the unknown event will materialise. If the contingent obligation is probable, or more likely than not, it is recorded in the financial statements and properly stated.
- Measurability
This second criterion examines whether it is possible to calculate the contingent liability’s amount with accuracy. The corporation assesses the liability and makes a provision on the balance sheet to reflect its prospective effect on its financial situation if it can make a reasonable assessment.
Managing Contingent Liabilities
Companies must manage and reduce contingent liabilities in order to maintain their financial health and secure shareholder interests. The following are important tactics that businesses can use to proactively handle contingent liabilities:
- Risk Assessment
Regular and thorough risk assessments are essential for identifying potential risks and exposures that could result in these liabilities. Companies can create suitable risk mitigation plans by analysing various risks’ likelihood and potential impact.
- Insurance
Enough insurance protection is crucial for guarding against possible losses brought on by prospective liabilities. Companies should conduct a thorough risk assessment and invest in insurance plans that address the necessary risks.
A few examples of this kind of insurance are general liability, product liability, directors and officers (D&O) liability, and professional liability. Insurance acts as a safety net, minimizing the negative effects of these liabilities on the company’s financial statements and protecting cash flow.
- Contractual Protections
Limiting potential liabilities requires carefully structured contracts. The obligations, responsibilities, and extent of each party’s liabilities in the event of a disagreement can be specified through clear and explicit contract terms. Including dispute resolution techniques like arbitration or mediation can aid in problem-solving more quickly and affordably.
Impact on Investors and Stakeholders
Contingent liabilities can greatly impact how stakeholders and investors see a company’s management, stability, and financial health. There are numerous approaches to observing the impact on investors and stakeholders:
- Valuation
Potential contingent liabilities may directly impact a company’s valuation. When calculating the company’s value, analysts and investors consider the inherent risks. If the firm’s these liabilities are substantial and their potential impact is severe, investors may give the company a lower valuation, which would cause the stock price to decline.

- Creditworthiness
When determining a company’s creditworthiness, lenders and creditors pay special attention to its contingent liabilities. High contingent liabilities could make it difficult for the business to fulfill its financial commitments, including debt repayments.
- Shareholder Confidence
Establishing and sustaining shareholder confidence requires open disclosure of contingent liabilities. When businesses provide clear and thorough information, investors and stakeholders are better informed about the company’s exposure to uncertainty. This can be achieved by describing potential risks and how they will be managed in the financial statements’ footnotes.
This openness encourages confidence in the company’s management and its dedication to overcoming possible obstacles.
Conclusion
The effective management of contingent liabilities is essential for a company’s long-term survival in today’s fiercely competitive business world.
Companies can ensure financial stability and sustainability by proactively managing these liabilities. This allows them to focus on innovation, growth, and strengthening their market position, thereby generating value for all parties involved.
Follow us at TradeAlone.com to stay updated with the latest market news.

Options trading can have a significant impact on stock prices, both directly and indirectly. In this article, we will explore the various ways in which options trading influences stock prices, including through delta hedging, volatility effects, and market sentiment.
1. Delta Hedging
Delta hedging is a trading strategy used by investors to mitigate the risk of changes in the price of an option by buying or selling the underlying asset. For instance, if an investor purchases a call option on a stock, they may also buy shares of the stock to offset the risk of a potential price decrease. This buying pressure created by delta hedging can contribute to pushing up the stock price.
2. Volatility Effects
Volatility plays a crucial role in options trading and can indirectly impact stock prices. Options prices tend to be higher when there is higher market volatility and lower when volatility is low. Investors are willing to pay more for options when they expect significant price movements in the underlying asset. Thus, an increase in options trading activity can lead to higher volatility in the underlying asset, which, in turn, may result in higher stock prices.
3. Market Sentiment
Options trading can be a reflection of market sentiment, which is a measure of how bullish or bearish investors feel about a particular asset. When there is a substantial amount of options trading on a specific stock, it can indicate a strong bullish or bearish sentiment towards that stock. This sentiment can influence stock prices in the direction of the prevailing sentiment.
4 . Supply and Demand Dynamics

The primary ways options trading impacts stock prices is through changes in supply and demand dynamics. As investors buy and sell options contracts, it affects the perceived interest in the underlying stock. When there is a surge in demand for call options (the right to buy the stock), it indicates bullish sentiment, potentially leading to higher stock prices. Conversely, an increase in demand for put options (the right to sell the stock) signals bearish sentiment and could result in lower stock prices.
5. Volatility and Implied Volatility
Options trading can introduce additional volatility to the stock market. The prices of options themselves are influenced by market volatility expectations, which are measured by implied volatility. If there is heightened uncertainty or news events surrounding a stock, implied volatility may rise, leading to more expensive options. As a result, the stock price may experience larger swings as traders adjust their positions to factor in the changing volatility.
6. Options Expiration and Pinning
Options have an expiration date, and as that date approaches, traders may adjust their positions or decide to exercise their options. This behavior can lead to increased trading activity and volatility as the expiration date nears. Additionally, “options pinning” or “options max pain” refers to the phenomenon where the stock price gravitates toward the price that causes the most options contracts to expire worthless, benefiting options writers. This pinning effect can influence short-term stock price movements, especially around expiration dates.
7. Hedging Strategies
Market makers and professional traders use options as part of their hedging strategies to manage risk in their portfolios. When they sell options, they often hedge their positions by buying or selling the underlying stock. This hedging activity can affect the stock’s price by creating additional buying or selling pressure. For instance, when market makers sell call options, they may buy the underlying stock to hedge against potential losses, leading to increased demand and higher prices.
8. Impact on Investor Sentiment
Options trading can impact investor sentiment and perception of a stock. Unusual options activity, such as a surge in call buying, may be interpreted as a signal of positive expectations for the stock’s future performance. On the other hand, heavy put buying might lead to negative sentiment and dampen the stock’s price.
9. The Small and Indirect Impact
While options trading can have a notable impact on stock prices, it is essential to understand that this influence is typically more pronounced in the short term rather than the long term. The effects can be more significant for highly liquid stocks with higher volatility levels. However, in general, the impact of options trading on stock prices might be small and challenging to predict due to the complexities of the options market and other influencing factors.
Option Pricing Model
Here is a table of the most common option pricing models:
| Model | Description |
|---|---|
| Black-Scholes model | A mathematical model that uses five inputs to price options: the strike price, the current stock price, the time to expiration, the risk-free rate, and the volatility. |
| Binomial model | A discrete-time model that prices options by assuming that the underlying asset can only move up or down by a certain percentage in each time step. |
| Monte Carlo model | A simulation-based model that prices options by randomly generating a large number of possible price paths for the underlying asset. |
| Heston model | A stochastic volatility model that prices options by assuming that the volatility of the underlying asset is itself a stochastic process. |
| SABR model | A simplified version of the Heston model that is easier to calibrate and use. |
The Black-Scholes model is the most widely used option pricing model, but it is not without its limitations. The model assumes that the underlying asset follows a geometric Brownian motion, which is a continuous-time random walk. This assumption is not always accurate, especially in the short term. The Binomial model and the Monte Carlo model are more accurate than the Black-Scholes model, but they are also more computationally expensive.
The choice of which option pricing model to use depends on a number of factors, including the type of option, the time to expiration, and the volatility of the underlying asset. In general, the Black-Scholes model is a good starting point, but it may be necessary to use a more complex model if the underlying asset is volatile or if the option has a long time to expiration.

| Model | Advantages | Disadvantages |
|---|---|---|
| Black-Scholes model | Simple to use, widely available | Assumptions may not be accurate |
| Binomial model | More accurate than the Black-Scholes model | Computationally expensive |
| Monte Carlo model | Most accurate option pricing model | Computationally very expensive |
| Heston model | More accurate than the Black-Scholes model | Assumptions may not be accurate |
| SABR model | Simplified version of the Heston model | Less accurate than the Heston model |
Conclusion
Options trading can exert both direct and indirect influence on stock prices. Delta hedging can create buying pressure on the underlying asset, pushing up stock prices. Volatility effects can result in increased options prices and subsequently higher stock price fluctuations. Additionally, options trading activity can reflect market sentiment, leading to stock price movements in the direction of prevailing sentiment. However, it is important to recognize that the impact of options trading on stock prices is typically more pronounced in the short term, and predicting its effects can be challenging. As with any investment activity, thorough research and consideration of the risks are crucial when engaging in options trading.
Visit Tradealone for more Updates

What is the EPS of a company?
A simple and unbending meaning of EPS is Earnings per Share of the company. What is known as the earnings of a company? The earnings of a company refer to its net income, which is obtained after deducting the cost of goods sold (COGS), operating expenses, interest, and taxes from its total sales revenue. If we take a P&L statement of a company, the total revenue of a company is seen in the initial line items. This is followed by COGS, operating & admin expenses, and then interest and tax expenses. A P&L statement gives an investor the outline of the company’s earnings.
The formula to calculate the EPS of a company is EPS=Net income of the company/Total number of outstanding shares.
EPS is profit that belongs to the shareholders and it says us how much profit a company has earned for every share issued. Without much more explanation, let us go to the core of the article.
Let us see factors that fuel the EPS growth of a company
Factors Fuelling EPS Growth
- Increase in sales
- Increase in productivity
- Reduction in costs
- Reduction in interest caused by debt
- Expansion of business
Increase in sales
A company always aims to increase sales, but the strategies it uses makes a difference. The most effective way a company can improve its sales is by
- Establishing a better connection with customers by providing user-friendly products
- Use proper marketing and sales strategy to develop the business
- Improving the business model of the company by being financially healthy, engaging risk management, and hiring an efficient management team which propels future growth.
Increase in productivity
A company’s productivity increases when the employees make better use of their opportunities. The ways the company achieves it are
- Providing a learning platform for employees
- Implementing a flexible and attractive work culture.
- Paying the right worth of salary.
- Implementing the latest technology to attain efficiency.
Reduction in costs
The net income of a company can be improved in 2 ways. One happens when revenue is given importance, the other way is cutting costs. After all revenue and expenses form the crux of net income.
A company will handle different ways to cut its costs, they may lay off employees, close additional facilities, streamline supply-chain, cut costs on marketing and sales strategies, reduce outsourcing of work and hire efficient professionals and much more strategies are followed by companies to cut costs.
Reduce debt and interest
Debt is an obligation that involves a debtor and a creditor. Companies often borrow debt to expand their businesses or to fund the current business cycle. We can find debt in the liabilities section of a balance sheet. There as long-term and short-term debt. However, if a company’s current assets are higher enough to clear the debt the companies are debt-free. This debt incurs interest which weighs loads on the profitability of the business. Lesser the debt the company can have high earnings and eventually higher EPS.
Expansion of business
When a company wants to expand it is evident that the company has a well-established business. By expanding the company can acquire new customer concentration, increase profits, and launch new products or services. The most important strategy of expansion is eliminating insecurity held over a single market. Diversification happens and the company no longer needs 1 client or the same set of clients for its profits. This ultimately results in higher profits if the company plans strategically on expansion.
We understood the ways a company can increase its Earnings and ultimately the EPS. Now let us see a few companies which give consistent EPS growth over the years.
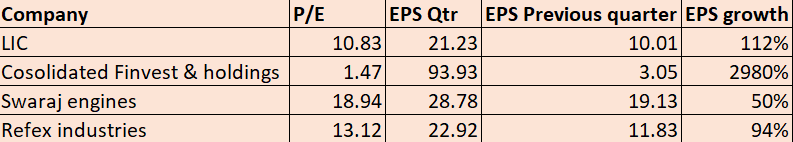
In this table, we can see a few stocks whose EPS grew innumerably higher from quarter to quarter.
We previously saw how an organization can improve its EPS through various steps, but consistency is the key. A company whose EPS growth is consistent over a period is very much attractive to investors.
How can an Investor profit from companies with consistent EPS growth?
- EPS gives is a direct synonym for a company’s profitability. A company that is financially stable gives steady EPS growth over the years.
- One of the crucial valuation ratios the PE ratio and PEG ratio depends on the value of EPS. The higher the EPS, the lower will be the PE ratio and companies with low PE ratio consistently attracts investors owing to their undervaluedness.
- Any investor considers 2 criteria before investing. One is the price appreciation of the asset, another is the periodic return generated. Which is also known as a dividend. A company with consistent growth in earnings indicates confidence in shareholders. An investor will prefer a company with a consistent dividend payout compared to one which is irregular in the payment of dividends.
- The company with consistent earnings growth looks promising and the market anticipates good future potential. This increases the price of the stock from which the investor gains profit.
Incorrect earnings
Sometimes the company registers an incorrect revenue in the P&L statement to create false beliefs about the company. They do this by holding the revenue of earlier quarters and accounting in them in consequent quarters to manipulate the investors despite the huge competition in the market regarding QoQ results. It is appropriate to look for the earnings transcript call in the investor presentation which explains the detailed revenue growth of the company.
In this article, we understood the meaning of EPS and the factors which fuel EPS growth. A table showing companies with excellent EPS QoQ growth was depicted. And we saw why a company with consistent EPS growth seems attractive to investors. EPS is a powerful metric when it is compared with its peers, or industry or even when it is compared over a period of time. EPS in solitary doesn’t depict the true picture of the company. An investor has to analyze the line items in the P&L statement beforehand. If the company registers consistent earnings growth, lies in blue ocean technology, is defensive to cyclicality, reduced debt, and controls expenses, you have spotted a multi-bagger!
-
 Profit Making Idea1 year ago
The Grandfather Son (GFS) Strategy: A Technical Analysis Trading Strategy
-

 Uncategorized8 months ago
A BJP victory and the Stock Market: what to expect this monday
-

 Technology5 months ago
Innovative Metro Ticketing Revolution in Pune by Route Mobile and Billeasy’s RCS Messaging. Stock trades flat
-
 editor9 months ago
How to research for Multibagger Stocks
-
 Trending12 months ago
Does the “Tata-Apple venture” benefit Tata shares?
-
 Finance World12 months ago
How Zomato Turned Profitable: A Landmark Achievement in the Indian Food Delivery Market
-
 Market ABC8 months ago
Spotting an operator game: How to do it?
-
 Market ABC1 year ago
The Pullback Strategy: A Timeless Approach to Investment Success