
editor
How to read balance sheet like an analyst?

Financial analysis becomes an essential part of any investment strategy and balance sheet becomes pivotal for the analysis. Why is analyzing a company’s finance much important, like analyzing the economy? indeed as an efficient analyst, it is important to understand the economy, the industry, the company and the legal regulations related to the company. While there are 2 ways to approach this:
- Top- down approach
- Bottom- up approach
In the top-down approach we will analyze the economy first, consequently the industry and then company.
In bottom-up approach, analysis starts with the company, followed by industry performance and the contribution of economy to the company.
So, either way the financial statements play a major role in fundamental analysis. In order to read a financial statement, the person does not need to be a great accountant, but he/she should be able to read and interpret the numbers.
Types of financial statements

Schedule III of companies Act, 2013 and Ind AS1 In India governs the list of financial statements and its format for a listed company. So as per the regulations, the financial statements has to consist of the following details in this particular format. The types of financial statements includes:
- Balance sheet– It provides information on assets, liabilities and equities at the end of the financial reporting period.
- Profit and loss statement– It provides information about the company’s financial performance which includes incomes, expenses, depreciation, interest, taxes and profits for a given period.
- Statement of changes in shareholder’s equity- The shareholder’s equity refers to the funds that belong to the shareholder. The changes happen on the account of profits earned, dividends issued, additional shares and buy back of shares.
- Cash flow statement– It provides information on various inputs and usage of cash. To know more about cashflow https://tradealone.com/cash-flow-vs-profit-understanding-the-key-differences/
- Detailed notes- It explains the accounting policy and break down of information presented in financial statement.
In this article, let us see how to read a balance sheet and its importance in long term investment strategy.
Balance sheet
Let me show an example of how a balance sheet should look like:

We need to look into consolidated financial statement, if the company is not a separate entity, but a part of another company. If its a separate entity, we need to look for its standalone financial statement.
Line items of balance sheet
Let us learn in detail about the common balance sheet line items:
Assets in balance sheet
In generalized terms, assets denote a product/possession that add value to the company or person. Assets in balance sheet denotes those which give future benefits. The assets which are quantifying in monetary terms in nature comes under assets. Assets that are self generating does not account here.
Assets are classified into
Non- current assets
The non-current assets comprises the following line items within it.
Property, plant and equipment(PPE)
These include assets such as land, building, machineries, furniture, computers and similar items. These assets are physical and tangible in nature, with life of more than 1 year. We revalue the PPE every year. It is because it comes under historical cost and depreciating every year. Rs.4377.98 crores is the value of PPE in above table.
Capital work in progress
These includes the assets that are currently under construction and is not ready for operation. After completing construction, they move to PPE.
Investment properties
If a company is making an investment in land or building which can’t be occupied substantially comes under investment properties.
Good will
Goodwill arises when a company acquires another business. It represent the amount of money paid above the fair value of net assets taken over. An example is Bharti airtel acquired Tigo Rwanda Ltd, with 100% stake. The fair value was of net assets were Rs.2838 crores, but Rs.3200 crores were paid. The balance amount is considered as goodwill.
Other intangible assets
Intangible assets refer to assets that cannot be touched. They include legal rights, acquired copy rights, patents and brand names. It is important to note that self generated assets, that arises due to good reputation of firm cannot be added here. Internally developed software programs are included in this asset.
Intangible assets under development
The intangible assets that are not yet ready to use, comes under this section. Once it is ready, it will be transferred to intangible assets.
Financial assets
This line item includes loans, advances and financial claims that are likely to be received in long term. Items that are related to debt that collect interest and principal are typically recognized at amortized cost. While other items are shown at market value.
Deferred tax assets
This line item represents the advance payment or overpayment of a company’s taxes, so that the difference in amount is returned to the company in the form of tax benefit.
Other non-current assets
The non- current assets, such as receivables over one year, advances made to employees, partner, director, advances made for acquiring fixed assets, incorporate investments, security deposits and other miscellaneous assets fall under this category.
Current assets
Cash and other current assets fall under this category. These assets can be converted into cash within 1 year. Types of current assets include:
Inventories
Inventories include value of goods, work in progress of raw materials and unsold finished good at the end of reporting period. This is represented as value of cost price or market value, whichever price is lower.
Financial assets
The current financial assets includes cash, cash equivalents, bank balances, short term investments, trade receivables and other financial claims that are likely to be received in 1 year.
- Trade receivables– Trade receivables are the money that are yet to be received from the customers
- Investments- They represent short-term investments that can be calculated in current market value.
- Loans- Loans that are expected to be received within 1 year.
- Cash and cash equivalents- It includes cash, money in current accounts and short-term bank deposits.
- Bank balances- It includes all the balances available in the bank account, other than that mentioned in cash equivalents.
- Other financial assets- It includes all other claims that are likely to be received in 1 year.
Current tax assets
Current tax assets are taxes that are expected to be recovered or paid to the tax authorities at the tax rate in the reporting period.
Other current assets
This includes assets that are likely to generate benefits within 1 year and may include prepaid expenses or any assets that will receive benefit in the form of good/ service rather in cash.
Equity in balance sheet
Equity represents the value that the shareholders of the company will receive if all the assets are liquidated and all the debts are paid of. It can be calculated by deducting liabilities from assets.
Share capital: It represents the face value of the paid up share capital of the company.
Retained earnings: It represents a part of the profit earned by the company, that has been set aside for futuristic purposes.
Minority or non-controlling interests: It represents the share of equity of a subsidiary company that belongs to separate entity of shareholders. This interest is available only in consolidated statement and not in stand alone statement.
Liabilities in balance sheet
Non- current liability
The liabilities which a company can fulfill after a year falls under NC liabilities.. The liabilities that fall under this category are:
Long term debt: It includes the amount that is repayable towards the borrowings in the form of loans or debentures/bonds that are due beyond 1 year. Due of some portion of long term debt will fall within thin 1 year. Such portion of long term debt is current portion of long term debt.
Lease liability: If a company has signed a lease contract on any asset for more than 1 year, it is recognized as lease liability. This includes the fair value of lease minus the amount repaid.
Other non-current financial liabilities: It includes any other long term debt that is due more than 1 year and has to be paid in monetary terms.
Provisions: A liability that is not fully quantified. They are not like reserves but, set to meet a specific obligation. Examples of provisions are retirement benefit obligation payable to employees on retirement, warranty obligations etc.
Deferred tax liabilities: It includes the taxes that can paid in the future. It happens because the company wishes to postpone the payment to avoid tax recognition in current period.
Current liabilities
Settling of the current liabilities takes place within 1 year.. Current liabilities include:
Short term debt or borrowings: The liabilities which takes less than a year to paid back includes in short term borrowings. The company pays the loan in 1 year. In some cases refinancing and rolling to next year happens.
Lease liabilities: If a company signs a lease that completes in 1 year fall under lease liabilities.
Trade payables: If a company has to pay money to the suppliers within 1 year of time, it comes under trade payables. It includes the amount payable to micro and small enterprises and other suppliers from which this company receives goods/ services.
Other current financial liabilities: It includes
- short term provisions
- current portion of long term liability
- deferred revenue
- Advance from customers
- Unpaid expenses and expenses accrued but not due.
While we discussed each line item and what is incorporated in it, let us see how to interpret these line items to achieve better financial analysis.
Interpretation of line items
Why is this financial statement called as Balance sheet? It is because the assets owned by the company is equal to the liabilities it holds along with equity investment brought into the company, thereby they are balanced. From analyzing the above balance sheet:
- The Capital work in progress has been reducing considerably compared to 2021, while the PPE has increasing, which means that assets that were under construction are in completing stage and added to PPE, which is a good sign of progress.
- Other financial assets has increased, when analyzed we found that derivative receivable and claim receivable were added in 2022.
- We can see the increasing long term, short term borrowings along with lease liabilities, which indicates borrowing of debt. The debt is used for PPE expansion.
- The retained earnings and non controlling interest has increased indicating profitability and increase in equity of the subsidiary.
- We can get a clear picture of line items, only if balance sheet in correlation with notes to account.
Ratio analysis using balance sheet:
Ratio analysis is helpful in expressing one line item as a percentage or multiple of another related item. Ratios helps in performing descriptive analysis, diagnostic studies and predictive analysis. The commonly used ratios, that includes line items from balance sheet alone and in combination with income statement are:
- Debt/ equity ratio= Long term debt/Net-worth
- Current ratio= Current assets/Current liabilities
- Quick ratio=(current assets- inventories)/Current liabilities
- Accounts receivable turnover= Revenue/Accounts receivable
- Accounts payable turnover= Purchases/Accounts payable.
- Assets turnover= Net sales/Total assets
- Inventory turn over=Net sales/ Inventory.
Other than ratios, Dupont analysis which gives a clearer picture of ROE. We can calculate it by using Balance sheet and P/L statement.
Dupont analysis, ROE= (Net profit/sales) x (Sales/Assets) x (Assets/Equity), which helps us analyze the reason for changes in ROE.
Balance sheet metrics
Although the standard categorization of balance sheet is not always helpful in analysis and we need some additional metrics to analyze better, they are :
Total debt
Debt is a obligation which settles through cash and charged interest to compensate time value of money but it is different from other liabilities. We sum up long term debt, current position of long term debt, short term debt, financial lease obligations and accumulated interest to find total debt.
| Secured loans + |
| Unsecured term loans+ |
| Non- convertible bonds+ |
| Financial lease obligation+ |
| Deferred payment obligation+ |
| Short term debt+ |
| = TOTAL DEBT |
Working capital
Working capital refers to the amount of money, a company is using in day to day operations of the business. We will be subtracting current assets from current liabilities to arrive at WC. With a negative working capital, a company can’t run business accordingly a positive WC indicates sufficient funds to run.
Core working capital
Sometimes the working capital can be misleading as is is a independent statement aslo not all current assets and liabilities arise out of everyday operations. Some business investments are not for business operations only and some liabilities can be current maturity of long term debt. This is when Core working capital come in place.
Core working capital = Inventory + Trade receivables-Trade payables.
| Inventory+ |
| Debtors |
| – Payables |
| = Working capital |
What did we learn?
A balance sheet is a investors information of the company’s assets, liabilities and equity. In this article we saw how a balance sheet looks, the line items of the balance sheet and what each line item means. By computing line items of balance sheet with P/L statement, we found corresponding ratios. We understood the raw data from balance sheet is less likely to help an investor, but with the metric such as total debt, working capital and core working capital , an investor can understand the core of operations. Balance sheet analyzes historical data and see how the company is performing. For futuristic projections, the Balance sheet, P/L statement and cash flow together will give a better investment vision.


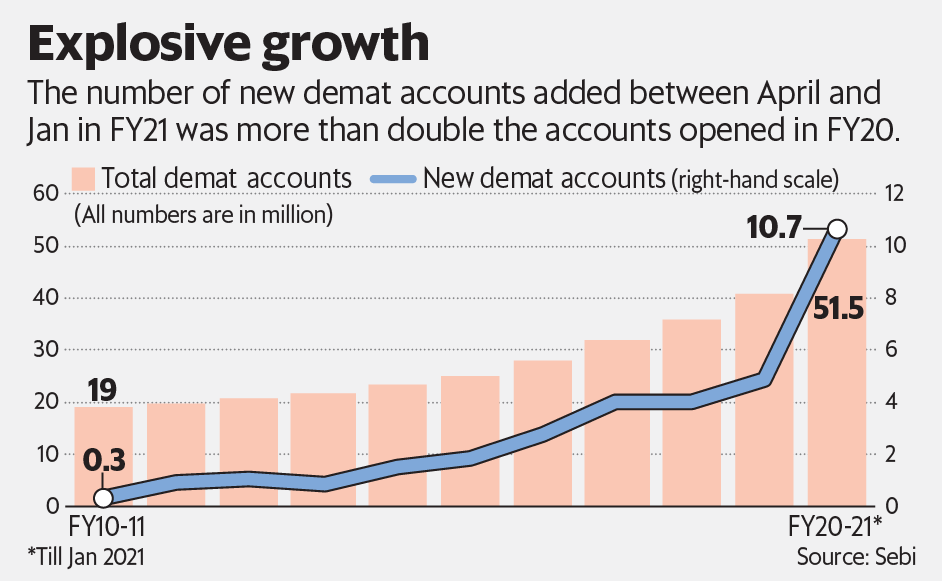
No matter your job, take a moment to observe your colleagues in the office, and you’ll likely find that nearly everyone is involved in the stock market trading these days. The younger crowd might be exploring cryptocurrencies. However, for those earning a regular salary, the stock market seems to be the go-to investment choice. Why is it gaining such traction? One word: profitability. Despite the ongoing fear of recession and the economic challenges post-COVID, the stock market hasn’t faced any significant downturns recently. This is largely because of a surge in the retail investors pouring their funds into the market. Expect this trend to stick around for at least the next five years. This makes the stock market a promising option for investors looking to get rich. Below is a chart on the explosive growth of Dmat accounts in India.
Finally, jumping into the question of whether trading can lead to wealth, the answer isn’t straightforward. While it’s true that numerous individuals have gathered wealth through trading, the majority have found success through long-term investments. However, trading does have the potential to significantly increase your wealth, provided you’re ready to dive deep into the details of stock price movements, have a bit of luck, and operate within a favorable market environment. Essentially, achieving wealth through trading requires being in the right stock at the right time during a market upswing, coupled with adequate capital and a solid understanding of both technical and fundamental market analysis. In this article, we’ll further explore the pathways to becoming wealthy through trading.
What is Trading?
Trading in the stock market involves engaging with a stock for a brief period. Essentially, it means purchasing a stock and selling it soon after for a profit, aiming to buy and sell quickly once a specific profit margin is achieved. Contrarily, investing is about buying stocks with the intention of holding onto them for long-term gains. Trading can be categorized into intraday trading or swing trading, each with its unique approach.
- Intraday Trading: This involves buying and selling stocks on the same day. The advantage here is the ability to buy up to five times the shares with the same amount of capital thanks to a 20% margin. However, the catch is the necessity to sell your shares by the day’s end, even at a loss, making it a speculative and high-risk endeavor.
- Swing Trading: This strategy is akin to investing but over a shorter timeframe, such as a week, a month, or a few months. The goal here is to sell the stock once a predetermined profit target is reached and then move on to another stock. Unlike intraday trading, swing trading does not compel you to sell if the stock’s value decreases after purchase.
In summary, both trading strategies aim for profit but differ significantly in their approach and risk levels.
How can I become rich by trading?
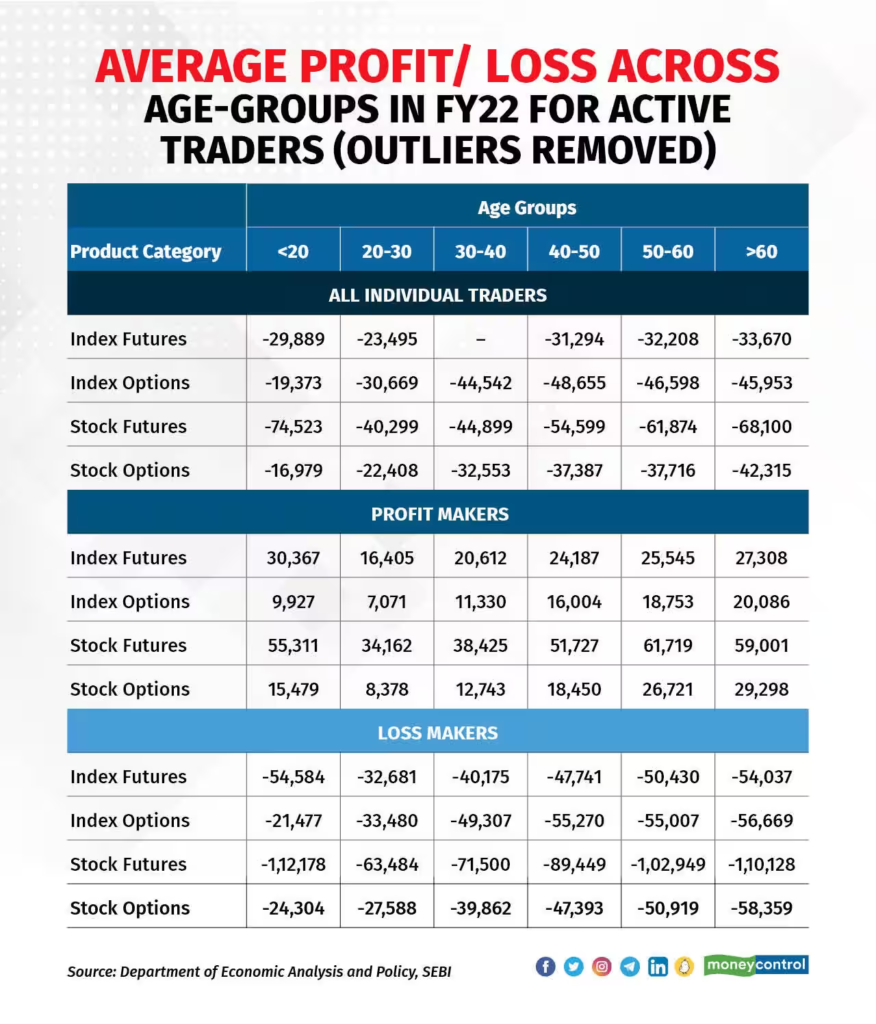
Becoming wealthy through trading isn’t as straightforward as it might seem. In India, a massive 90% of intraday traders conclude the year with losses. This stark statistic highlights the necessity of being among the elite 10% of traders just to secure a profit, let alone accumulate wealth. This means to get rich by trading, aiming for the top 2-3% of intraday traders is essential. Achieving this level of success requires rigorous study and a careful approach to avoiding common trading mistakes. Our goal here is to paint a realistic picture of the challenges involved in profiting from the stock market. However, stick with us as we explore strategies to join the ranks of the top 2% of traders. Meanwhile, lets take a look at the data for active traders in India.
Factors to consider to become a successful Trader
Despite extensive learning from books and YouTube videos, losses in the stock market are still possible because trading requires attentiveness to various factors, much like driving. To assist, we’ve compiled a list of essential factors to consider, ensuring a more informed trading approach.
- Focus on learning the fundamentals: Understanding the distinction between profitable and loss-making traders is crucial, and it often comes down to one key factor: learning how to trade effectively. Luck might bring success once or twice, but for consistent positive outcomes, acquiring trading knowledge is essential. To delve deeper into the fundamentals of trading and enhance your skills, consider our free and paid courses.
- Keep realistic expectations: Doubling your money weekly is unrealistic without time travel. My personal best was a 20% gain in a month during a significant bull run, using both swing and intraday trading. Typically, you might aim for a maximum of 5% monthly. However, in adverse conditions or a bear market, achieving any profit can be challenging, and losses are possible. So, it is essential that you maintain realistic expectations from the stock market. It is not a money making machine that can make you rich in a few months.
- Start as early as possible: Achieving wealth is a personal goal; for example, earning 1 crore might be one’s definition of being rich. To accumulate such wealth from the stock market requires either substantial initial capital or a long-term commitment. Starting in your early twenties could be advantageous for those aiming to build significant wealth through trading. I personally started at the age of 24 and I have made a lot of money in my journey of 3 years. So, I have plenty of time to compound my earnings now.
- Trade only on opportunity: Achieving consistent profits in trading relies on capturing the right opportunities rather than engaging in unnecessary trading, which often leads to losses. It’s crucial not to feel compelled to trade daily. If the trading conditions you rely on aren’t present on a particular day, it’s wise to step back. Patience and strategic action based on well-defined opportunities are key to success in the trading world.
- Take risks when theres a chance: There will be oppertunities where you’d be sure of your trade, in those instances you could play with more amount of money. for example you have 100 Rupees and usually you trade in 5 stocks with 20 rupees each. but on certain day you see a very high probability of a share to go up by 5%, in those situations you may have to play a single trade with 100 Rupees to get the most out of the trade.
- Don’t get obsessed about a single stock: It may happen that a stock which you expect to go up by 10% is now stuck in a small range and is showing unpredicatble price movement. In those situations, you dont have to be obsessed about that stock and regardless of the bad situations end up trading on that. every stock presents an equal opertunity, dont generate affection with a particular stock.
- Try to trade in the momentum: Mornings are where most of the movement is seen in stocks based on the news. so, make the most of this and try to enter in the morning hours, preferably after the opening hours. this helps because theres a lot of volume action in the morning time. where theres volume means more possibility of stock price to move in a higher range. read our volume analysis report here.
Even if you follow all the above rules, you might still find yourself in difficult situations due to the dynamic nature of the stock market. We have covered a few of these situations below. The most important thing here is consistent learning and elevated self-confidence. Remember, don’t become obsessed with the stock market; it won’t change your life overnight.
What if I lose most of my money?
Trading can result in significant losses. If you find yourself making consecutive incorrect trades, it’s advisable to pause and reflect on the causes of these setbacks. Assess whether it was a poor choice of company or overlooked critical factors in stock selection. Every trade offers a learning opportunity, so maintain a notebook to note down mistakes after each unsuccessful trade. This practice helps in identifying patterns in errors and refining future trading strategies.
What should be my capital?
We recommend starting with 20,000 rupees to see if trading suits you. It’s crucial to assess whether you can manage the stress of daily gains and losses. While taking inspiration from others and YouTube channels is beneficial, you should avoid making trades solely based on someone else’s advice. There’s a temptation to increase your capital after a few successful trades, but don’t let it dominate your decision-making. Often, traders start losing money as soon as they invest more.
How much can I expect?
Don’t expect the market to make you ultra-rich in a short period. It’s best to enjoy your job and aim to improve your earnings and learning. Trading can provide additional funds for spending or reinvesting, but it should not be relied upon for daily living. Keep your expectations realistic. You might aim for 30-40% profits annually if you become very skilled. Remember, many stocks could potentially grow 30-40% within a year without causing you stress.
Where to learn about trading?
There are many books available on Amazon that you can refer to. “Trade Like a Stock Market Wizard” is my top pick. This book is for swing traders and not intraday traders. I personally feel swing trading offers more potential if you have a large capital. But, if you are new to the stock market, intraday trading with a small capital can give you much more learning and lessons. You can follow multiple Telegram or YouTube channels as well. However, be cautious as many of these influencers are turning out to be frauds.
Thus, is it very difficult to become rich by trading in the stock market. However, its not very difficult to accumulate wealth by trading on the favourable instances.

Paytm is a loss making machine from the day it got listed on the NSE index. The recent weeks have been the most painful. The company faced a series of regulatory setbacks, stock price fluctuations, and operational changes, which have left investors and market observers scratching their heads. Let’s break down what happened to Paytm and explore what investors should consider doing next.
Key Events Impacting the Paytm stock
- RBI’s Directive: Starting February, the Reserve Bank of India (RBI) put a stop to Paytm Payments Bank’s new deposits and wallet transactions. This move was a significant blow to Paytm’s operations.
- Stock Price Tumbles: Following a report from Macquarie that lowered Paytm’s target price to Rs 275 and downgraded its rating to “Underperform,” Paytm’s stock price fell by 8.5%. The stock hit an all-time low of Rs 386.25, indicating a notable loss of confidence among investors.
- Regulatory Challenges: Paytm’s regulatory hurdles, especially the RBI’s restrictions, have raised alarms, contributing to the stock trading at an 81% discount from its IPO price.
Paytm Stock Price since the listing day – A continues decline.

Before we proceed, it’s important to bear in mind that a company facing profit challenges in a competitive industry is likely to encounter difficulties. As informed and savvy investors, we must maintain our stock selection filters and not rush into purchasing such stocks during minor recoveries. Keep in mind, a stock’s price doesn’t rise or fall in a single movement; it fluctuates, but the overall trend is what truly matters. Therefore, if you’re not already invested and are tempted to buy in at these low prices, exercise caution.
Ok, now back to the events that unfolded for Paytm over this month.
February’s Rollercoaster Ride for the Paytm stock
- February 1: Reserve Bank of India (RBI) ordered Paytm Payments Bank to halt the acquisition of fresh deposits into its accounts or wallets effective February 29. This decision sent shockwaves through the market, leading to an 8.5% drop in Paytm’s stock price. Then leading investment firms started to cut the target price of Paytm.
- February 2: Paytm’s stock opened at a 20% lower circuit, anticipating a significant EBITDA impact.
- February 3: Morgan Stanley Asia Singapore Pte bought 50,00,000 shares of Paytm, signaling some investor confidence. But, this probably will turn out to be a bad decision!
- February 4: BSE adjusted Paytm’s daily stock limit to 10% after two consecutive days of hitting a 20% lower circuit. The stock was in an uncontrolled fall for a couple of days.
- February 5: Jio Financial Services’ shares surged due to false news about acquiring Paytm’s wallet business. General public was anticipating that either Tata or Ambani will acquire Paytm business.
- Mid-February Developments: Paytm faced further challenges, including being removed from the list of authorized banks for FASTag services by NHAI. However, the RBI confirmed Paytm’s operational functionalities would continue beyond March 15, 2024, after shifting nodal accounts to Axis Bank. The Enforcement Directorate also found no FEMA violations by Paytm Payments Bank Limited.
Investor Takeaways
- Regulatory Compliance: It’s crucial for businesses to stay aligned with local regulations. Compliance should be seen as an essential part of operations, not a burden.
Quote from a investor sitting on a heavy loss in Paytm share – “I am sitting in the loss of a few lakhs as I trusted Paytm and purchased the stock. Can you convince your investors how are you going to fill that loss and what are your future plans?”
Another retail investor tried to warn general public to not catch the falling knife. He said – “Never buy any stock making hype in media/social media for any reason,+ve or -ve. You will save yourself from alot of blunders! For example, think about the people who bought paytm on first reversal. while they know everything still they are trapped.”
- Funding and Market Entry: Companies need to be mindful about their sources of funding and how they expand, especially in politically sensitive times.
- Focus is Key: Diversifying is good, but not at the cost of losing sight of the core business. Companies must ensure their primary operations are solid and compliant. Investors must have a long term view and not shuffle their portfolio unless there is a need to do so. We are sure that many retail investors must have sold their profit making shares and purchased Paytm at a 20% correction anticipating some gains. But, remember that once you are trapped in a loss making company, you could remain trapped forever.
- Caution for Investors: Given Paytm’s current situation, with significant stock price volatility and regulatory challenges, investors should proceed with caution. It’s advisable to consult with a financial advisor, especially if you’re already invested.
Read more about the fundamental analysis of Paytm below. Can Paytm turn Profitable?
Why Paytm share hit an upper circuit?
This is where things get exciting, Paytm has hit a 5% upper circuit for a couple of consecutive days now. Axis Bank helped Paytm this time as Paytm partnered with Axis Bank for the settlement of merchant payments. Paytm has shifted its nodal account to Axis Bank through an escrow account that it has opened with it. But remember, stock price will eventually is decided by company performance and balance sheet. These upper circuits are news driven, as of now we are not sure what kind of impact will this have on the functionality of Paytm.

Moving Forward
Paytm’s recent experiences underscore the complex landscape of financial technology in India. For investors, these developments are a reminder of the importance of diligence and cautious optimism when dealing with stocks facing regulatory and operational hurdles.
For those invested in or considering an investment in Paytm, staying informed and seeking professional advice is key. The path ahead for Paytm is fraught with challenges, but with careful navigation, there may still be opportunities for growth and recovery. Keep following Tradealone for more such informative content.
What are your thoughts on the Paytm situation? Do you believe the company will overcome these challenges? Share your views in the comments below.

In the dynamic landscape of Indian real estate, it’s crucial to see the market for what it truly is. Unlike in many Western countries, where populations are declining, India’s demographic trajectory paints a different picture. Let’s dive into the nuances of the Indian real estate market, shedding light on who wins, who loses, and how to navigate these waters.
Population Growth and Housing Demand
India’s population is not on the decline; predictions suggest it will peak around 2065. This demographic trend ensures that housing demand will remain robust for the foreseeable future. Unlike transient market trends, the basic need for housing, driven by a growing population, is a fundamental force that will sustain demand.
The Buying Behavior of the Rich
In India, real estate often finds favor with the affluent as a diversification strategy or a means to save on taxes. This segment of buyers is not just looking for any real estate; they’re in the market for ‘good’ real estate at fair prices. Their continued investment underlines a belief in the market’s growth potential. The narrative here is not just about investment but about strategic acquisition based on value, not just price.
The Middle-Class Quandary
The real estate dream, however, turns a bit complex for the middle class. Many find themselves navigating overpriced “boxes in the sky” in cities like Gurgaon or Noida. The crux of the issue lies in transparency—or the lack thereof. With an almost infinite supply from well-connected builders and no clear insight into fair pricing, the middle class often ends up buying at inflated prices. This experience has led many to view real estate as a dubious investment, though this isn’t the whole story.
Builders and Bankruptcy
It’s worth noting that builders do face financial hurdles, often not due to the value of the real estate itself but due to liquidity management issues. Rapid acquisition without proportional sales leads to cash flow problems, not necessarily losses on the property’s value. This distinction is crucial in understanding the market’s dynamics.
Buying Smart: The Key to Real Estate Investment
The mantra for success in real estate, much like in stocks, is buying at fair prices. In India, the trick is to look for properties with limited supply and unique characteristics in prime locations. This strategy not only shields one from the volatile swings of over-supplied markets but also ensures that the investment holds intrinsic value that appreciates over time.
The Bright Side of Indian Real Estate
India’s increasing population, coupled with a preference for nuclear families and the allure of real estate as a tax-saving vehicle, all contribute to a rising demand. Furthermore, India’s growing wealth and GDP bode well for the real estate market. However, potential investors should be mindful of liquidity—the capacity to endure periods when the money is tied up in property before it yields profit.
In conclusion, while the Indian real estate market presents vast opportunities, it also requires a nuanced understanding of its dynamics. For those looking to invest, the key lies in thorough research, patience, and a focus on properties that offer something truly unique. As the country’s economy grows and its population increases, the demand for quality real estate will continue to rise. Navigating this market with a strategic approach can unlock significant value for discerning investors. Check more investment related blogs here.
-
 Profit Making Idea1 year ago
The Grandfather Son (GFS) Strategy: A Technical Analysis Trading Strategy
-

 Uncategorized8 months ago
A BJP victory and the Stock Market: what to expect this monday
-

 Technology5 months ago
Innovative Metro Ticketing Revolution in Pune by Route Mobile and Billeasy’s RCS Messaging. Stock trades flat
-
editor9 months ago
How to research for Multibagger Stocks
-
 Trending12 months ago
Does the “Tata-Apple venture” benefit Tata shares?
-
 Finance World12 months ago
How Zomato Turned Profitable: A Landmark Achievement in the Indian Food Delivery Market
-
 Market ABC8 months ago
Spotting an operator game: How to do it?
-
 Market ABC1 year ago
The Pullback Strategy: A Timeless Approach to Investment Success