
Profit Making Idea
How to Spot Trend Reversals: A Comprehensive Guide

In the world of finance and trading, spotting trend reversals is a crucial skill that can make all the difference between success and failure. Trend reversals occur when the direction of a market’s movement changes, and identifying trend reversal pattern early on can provide traders with significant opportunities for profit.
In this comprehensive guide, we will delve deep into the art of spotting trend reversals. We will cover various techniques, indicators, and strategies that can help you become a more adept trend trader. So, if you want to enhance your trading skills and stay ahead in the ever-changing financial markets, read on!
How to Spot Trend Reversals
Identifying trend reversals requires a keen eye and a solid understanding of market dynamics. Here are some effective ways to spot trend reversals:
1. Pay Attention to Price Patterns

Identifying Reversal PatternsPrice patterns, such as double tops, double bottoms, head and shoulders, and triangles, can provide valuable insights into potential trend reversals. Keep a close eye on these patterns, as they often signal shifts in market sentiment.
2. Utilize Moving Averages

Moving averages are popular technical indicators that smooth out price data and reveal the underlying trend. When a shorter-term moving average crosses above a longer-term one, it could indicate a bullish trend reversal, and vice versa.
3. Spot Divergence in Oscillators

Oscillators like the Relative Strength Index (RSI) and Moving Average Convergence Divergence (MACD) can help identify divergence between price movements and the oscillator itself. Divergence can foretell potential reversals in the current trend.
4. Follow Volume Changes

Unusual changes in trading volume can be a strong indicator of an upcoming trend reversal. A sudden surge or decline in volume can signal that market participants are changing their views on an asset’s future direction.
5. Observe Support and Resistance Levels

Support and resistance levels act as barriers to price movements. A break of a significant support or resistance level may indicate a trend reversal, as the market’s sentiment shifts.
6. Keep an Eye on Trendlines

Trendlines drawn on price charts can offer valuable clues about trend reversals. When a trendline is decisively broken, it could signal a change in the prevailing trend.
7. Fibonacci Retracements

Fibonacci retracement levels can help identify potential areas where trend reversals might occur. Traders often watch for price reactions at these levels to confirm a reversal.
8. Sentiment Analysis

Stay informed about market sentiment through news, social media, and sentiment indicators. Extreme optimism or pessimism can hint at a trend reversal on the horizon.
9. Apply Parabolic SAR

The Parabolic Stop and Reverse (SAR) indicator provides visual points on a price chart that indicate potential trend reversals.
10. Look for Candlestick Reversal Patterns

Candlestick patterns like Doji, Hammer, and Shooting Star can suggest an impending trend reversal and offer valuable entry and exit signals.
============================================
How to Spot Trend Reversals with Chartink

Here is an analysis of the technicals behind trend reversal, using the Chartink screener “Trend Reversal 4” as an example:
The Chartink screener “Trend Reversal 4” uses a number of technical indicators to identify stocks that are showing signs of a trend reversal. These indicators include:
- Relative strength index (RSI): It is a momentum indicator. A reading of 70 or above indicates that a stock is overbought and may be due for a reversal. A reading of 30 or below indicates that a stock is oversold and may be due for a reversal.
- Bollinger bands: Bollinger bands are a volatility indicator that use moving averages to identify overbought and oversold conditions. A stock is considered overbought when the price is trading above the upper Bollinger band. A stock is considered oversold when the price is trading below the lower Bollinger band.
In addition to these technical indicators, the Chartink screener also applies a number of filters to narrow down the list of stocks that are considered to be “trend reversals“. These filters include:
- Price: The screener only considers stocks that are trading above a certain price.
- Market capitalization: The screener only considers stocks that have a certain market capitalization.
- Sector: The screener only considers stocks in certain sectors.
- Industry: The screener only considers stocks in certain industries.
By applying these filters, the Chartink screener can help to identify stocks that are showing signs of a trend reversal and that have the potential to be profitable trades.
However, it is important to remember that no single technical indicator or filter is foolproof. It is always best to use a combination of indicators and filters and to pay attention to the overall market environment before making any trading decisions.
Here are some additional tips for spotting trend reversals:
- Look for key reversal patterns. These are specific formations on a chart that often signal a change in trend. Some examples of key reversal patterns include double tops and bottoms, head and shoulders tops and bottoms, and triangles.
- Look for divergences. Divergences occur when an indicator moves in the opposite direction of the price action.
- Monitor support and resistance levels. Support and resistance levels are price points where buyers and sellers tend to come together. If the price breaks through a support level, it could be a sign that the trend is reversing to the downside. Conversely, if the price breaks through a resistance level, it could be a sign that the trend is reversing to the upside.
By following these tips, you can increase your chances of spotting trend reversals and making profitable trades.
Strategy for Trend reversals from the top, focusing on when to exit a high growth company:
When to Exit a High-Growth Company?

High-growth companies can be very attractive investments. They often offer the potential for significant profits, as they can grow their earnings at a rapid pace. However, it is important to remember that all growth stocks eventually reach a point where they stop growing as quickly. This is known as a trend reversal, and it can be a difficult time for investors.
There are a number of factors that can contribute to a trend reversal in a high-growth company. These include:
- Competition: As a high-growth company becomes more successful, it attracts more competition. This can lead to a decrease in market share and profitability.
- Regulation: Changes in regulation can also impact the growth of a high-growth company. For example, a new law that requires companies to comply with more stringent environmental regulations can add to costs and reduce profits.
- Economic slowdown: A general economic slowdown can also impact the growth of a high-growth company. When consumers have less money to spend, they may be less likely to buy the company’s products or services.
If you are invested in a high-growth company, it is important to be aware of the potential for a trend reversal. There are a number of things you can do to protect your investment, such as:
- Set stop losses: A stop loss is an order that automatically sells your shares if the price falls below a certain level. This can help to limit your losses if the company’s stock price does experience a trend reversal.
- Do your research: Keep up to date on the company’s financial performance and news about the industry. This will help you to identify any potential risks that could lead to a trend reversal.
- Be patient: Don’t expect high-growth companies to continue growing at an exponential rate forever. Be prepared to sell your shares if the company’s growth starts to slow down.
Trend reversals can be a difficult time for investors, but they are a natural part of the investment cycle. By understanding the factors that can contribute to a trend reversal and by taking steps to protect your investment, you can increase your chances of success.
Here are some examples of high-growth companies that experienced trend reversals:
- Relaxo Footwears: Relaxo Footwears is a leading footwear company in India. The company’s stock price had been on a tear in recent years, but it has since fallen by more than 40%. This is due to a number of factors, including increased competition and rising costs.

- Tata Elxsi: Tata Elxsi is a leading technology company in India. The company’s stock price had been on a strong run in recent years, but it has since fallen by more than 50%. This is due to a number of factors, including a slowdown in the global semiconductor market and concerns about the company’s debt levels.

- Mastek: Mastek is a leading IT services company in India. The company’s stock price had been on a steady climb in recent years, but it has since fallen by more than 40%. This is due to a number of factors, including increased competition and concerns about the company’s future growth prospects.

These are just a few examples of high-growth companies that have experienced trend reversals. It is important to remember that all growth stocks are eventually cyclical, and they will eventually reach a point where they stop growing as quickly. By understanding the factors that can contribute to a trend reversal and by taking steps to protect your investment, you can increase your chances of success.
Key Takeaways:-
Q1. What is a trend reversal?
It occurs when an uptrend changes to a downtrend or vice versa.
Q2. Why is spotting trend reversals important?
Identifying trend reversals can help traders avoid losses and capitalize on potential profit opportunities by entering or exiting positions at the right time.
Q3. Can I use multiple indicators to confirm a trend reversal?
Yes, using a combination of indicators can increase the accuracy of spotting trend reversals. Confirming signals from different indicators can strengthen your trading decisions.
Q4. Are trend reversals predictable?
While trend reversals cannot be predicted with absolute certainty, technical analysis and indicators can help increase the likelihood of identifying potential reversal points.
Q5. How can I reduce the risk of false trend reversal signals?
Using multiple indicators, analyzing different timeframes, and waiting for confirmation before taking action can help reduce false signals.
Q6. What is the best time frame to spot trend reversals?
The best time frame to spot trend reversals depends on your trading style and objectives. Short-term traders may prefer lower timeframes, while long-term investors might focus on higher timeframes.
Conclusion
Spotting trend reversals is a skill that can greatly benefit traders and investors in the financial markets. By combining various technical indicators, price patterns, and sentiment analysis, you can increase your chances of identifying potential trend reversals accurately.
Remember, trading always involves some level of risk, so risk management and proper money management are essential. Keep practicing and refining your skills, and with time and experience, you’ll become better at spotting trend reversals.


Hey investors! Let’s talk about Infosys and its recent ups and downs. Despite some not-so-great results, their ADR (American Depositary Receipt) is up by 5%. It’s a bit of a head-scratcher, right? So, what should you, as an Indian investor, do in this situation? Let’s break it down.
The Latest with Infosys
- ADR Up by 5%: Even though the results weren’t strong, Infosys’ ADR went up. It seems like the market had already anticipated this, and maybe some short sellers got caught off-guard.
- Q3 Results: The revenue barely budged, and net profit actually fell by 7% compared to last year. Not the best news, honestly.
- In Semi Acquisition: A big move by Infosys, acquiring In Semi, a big name in semiconductor design and embedded services. This could be a game-changer in the long run.
Analyzing the Numbers
- Profit and Revenue: The net profit is down, and revenue growth is almost flat. High interest costs are partly to blame here.
- New Deals Dropped: New deal signings took a nosedive from $7.7 billion to $3.2 billion. That’s a big drop.
- Attrition Rate: Good news here – it’s down to 12.9%. Less employee turnover is always a positive.
- Guidance for FY24: Infosys expects revenue growth of 1.5%-2.0% and an operating margin of 20%-22%.
What’s the Deal with Insemi?
Insemi’s acquisition is quite a highlight. They’re leaders in the semiconductor design space. This market is booming and expected to hit $800 billion by 2028. With Insemi, Infosys could become a significant player in this field.
The Mixed Bag
- Sector and Geographic Performance: Financial services and North America are still not performing well, but there’s some rebound in Europe.
- Cash Flow: Infosys has a healthy free cash flow, which is a good sign for its financial health.
So, What Should You Do?
- Understand the Big Picture: Look beyond just this quarter. Infosys is making moves that could pay off in the long run, especially with the Insemi acquisition.
- Diversification: Don’t put all your eggs in one basket. It’s crucial to have a diversified portfolio.
- Stay Updated: Keep an eye on how Infosys performs in the coming quarters, especially in their new ventures and market segments.
- Risk Assessment: Be aware of the risks involved. Infosys is facing some challenges, and you need to decide if you’re comfortable with that level of risk.
Final Thoughts
Infosys’ results were a mixed bag, and the stock’s reaction was a bit surprising. As an investor, it’s essential to stay informed and make decisions based on a comprehensive understanding of the company’s performance and potential. Keep watching the market and adjust your strategy as needed. Remember, investing is a marathon, not a sprint!
Since we talked about this IT giant Infosys, Lets explore some AI based companies as well.

Edelweiss Financial Services Limited has announced a public issue of Secured Redeemable Non-Convertible Debentures (NCDs) worth Rs 2,500 million, offering an effective yield of up to 10.46% per annum. With credit ratings from CRISIL A+/Stable and ICRA A+, these NCDs provide a safe investment avenue.
Issue Details and Tenures
The NCDs offer ten series with fixed coupons and tenure options of 24, 36, 60, and 120 months, presenting diverse interest payment frequencies. The effective annual yield for these NCDs ranges from 8.94% to 10.46% per annum, catering to different investment preferences.
Offering Timeline and Utilization of Funds
Scheduled to open on January 9, 2024, and close on January 22, 2024, at least 75% of the raised funds will be directed towards repaying/prepaying existing borrowings, ensuring financial stability. The remainder will support general corporate purposes, aligning with SEBI NCS Regulations.
Investor Incentives and Ratings
Investors holding debentures/bonds from the company or related entities may enjoy an additional incentive of up to 0.20% p.a. These NCDs carry ratings of CRISIL A+/Stable and ICRA A+, indicating stability despite negative implications.
Lead Managers and Listing
Trust Investment Advisors Private Limited and Nuvama Wealth Management Limited are the lead managers for this NCD issue, aiming to list the NCDs on BSE Limited. This listing will provide liquidity and ease of trading for investors.
About Edelweiss Financial Services Limited
Edelweiss Financial Services Limited, established in 1995, operates in investment banking and holds a prominent position in the financial sector. Starting as an investment banking firm, it later expanded its operations, reflecting strong credentials in financial services.
Edelweiss Financial Services Limited has unveiled a lucrative investment opportunity through its NCD issue, promising secured returns and prudent utilization of funds. As the issue opens for subscription, it’s an opportune moment for investors seeking stable yet high-yield investment avenues. With a diversified range of tenure options and regular interest payments, this offering aligns with different investor preferences. The company’s extensive experience in the financial sector adds credibility to this investment opportunity, promising reliable returns.
Key Takeaways
- Lucrative Investment Avenue
- Secured, High-Yield Returns
- Diverse Tenure Options
- Prudent Utilization of Funds
This blog introduces an investment opportunity provided by Edelweiss Financial Services Limited, shedding light on its NCD issue’s specifics and the company’s background. With its high yield and secure nature, this offering presents a compelling choice for investors seeking stable returns. Learn more about financial goal planning.

Allcargo Terminals Limited has recently hit the headlines with its stock price soaring to a 20% upper circuit. This remarkable surge raises an intriguing question: can we expect this rally to continue? Let’s dive into the company’s recent performance and sector trends to uncover insights. The upper circuit today was followed by a trendline breakout, shared by a user on twitter a few days ago.
The Catalyst Behind the Surge
Allcargo Terminals’ stock hitting the upper circuit is not just a random spike; it’s backed by solid performance and strategic moves. The company’s recent financial results for Q2FY24 show a robust 13% year-on-year increase in Container Freight Station (CFS) volumes, outpacing industry growth. But what does this mean for the stock’s future trajectory?
Analyzing Q2FY24 Performance
In Q2FY24, Allcargo Terminals demonstrated strong sequential improvement. The company not only witnessed a 6% quarter-on-quarter increase in CFS volumes but also reported revenue growth of 3% and a notable 12% increase in EBITDA. These figures indicate a positive momentum, which could be a key factor in driving the stock’s rally.
Digital Initiatives and Customer Experience
A significant aspect of Allcargo Terminals’ strategy is its focus on digital initiatives aimed at enhancing customer experience. This progressive approach is gaining traction, potentially contributing to the ongoing volume momentum. Such forward-thinking strategies are crucial in determining whether the rally has the legs to continue.

Leadership and Financial Health
The induction of Mr. Pritam Vartak as CFO marks a strategic strengthening of the leadership team, potentially boosting investor confidence. Furthermore, the company’s robust balance sheet and net debt-free status provide a solid foundation for sustainable growth, which could be pivotal in maintaining the rally.
Allcargo Terminals in the Wider Logistics Sector
Allcargo Terminals, with its extensive network and digital prowess, is well-positioned in the logistics sector. As the industry navigates through a period of transformation, ATL’s innovative approach and strategic expansions could play a crucial role in sustaining its market rally.
The Road Ahead: Predicting the Rally’s Course
While Allcargo Terminals’ recent performance is impressive, predicting the stock market is always a complex endeavor. Factors such as broader market trends, economic conditions, and company-specific developments will influence the stock’s trajectory.
In conclusion, Allcargo Terminals Limited’s recent upper circuit hit reflects its strong performance and strategic initiatives. While the current indicators are positive, the sustainability of the rally will depend on continued performance excellence and favorable market conditions. What’s your take on Allcargo Terminals’ future in the stock market? Let’s engage in a discussion about the exciting possibilities ahead for this dynamic company! 🚀💹📈
We like Adani ports as well in the shipment and cargo field. Keep following us for more such technical analysis.
-
 Profit Making Idea1 year ago
The Grandfather Son (GFS) Strategy: A Technical Analysis Trading Strategy
-

 Uncategorized8 months ago
A BJP victory and the Stock Market: what to expect this monday
-

 Technology5 months ago
Innovative Metro Ticketing Revolution in Pune by Route Mobile and Billeasy’s RCS Messaging. Stock trades flat
-
 editor9 months ago
How to research for Multibagger Stocks
-
 Trending12 months ago
Does the “Tata-Apple venture” benefit Tata shares?
-
 Finance World12 months ago
How Zomato Turned Profitable: A Landmark Achievement in the Indian Food Delivery Market
-
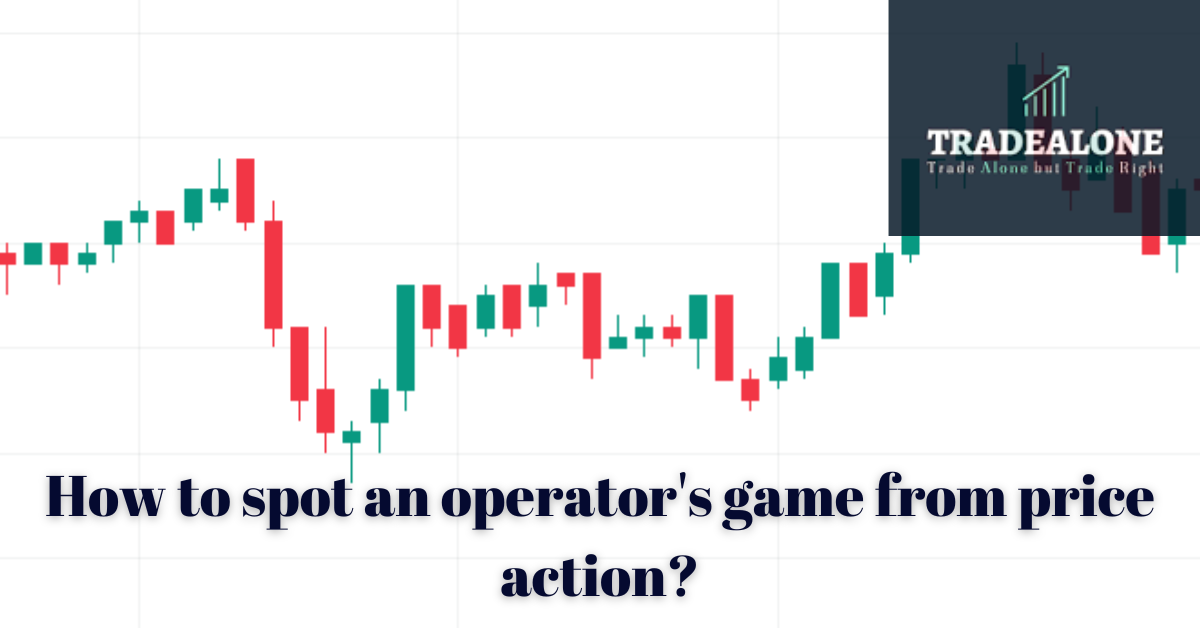 Market ABC8 months ago
Spotting an operator game: How to do it?
-
 Market ABC1 year ago
The Pullback Strategy: A Timeless Approach to Investment Success