
Quarterly Results
Mastek GAINS13% Post Foreign Promoter Investment
Mastek ltd. recently announced their quarterly results and investors have been going gaga over this.
Hello traders, hope the markets are blessing you more than ever. In this blog, we will dive deeper into the recently announced financials of Mastek ltd. And attempt to uncover Mastek’s recent rally and sudden investor interest. So buckle up because you know what’s about to get real.
For the March quarter, Mastek limited, has definitely managed to steal the limelight. The small cap tech enterprise has recently attracted foreign promoter interest leading to an increased investment in the firm.
The net foreign promoter holding which till the last quarter has constantly been around 11.41%, experienced a sudden increase.
This has sparked multiple speculations about Mastek’s growth opportunities and investment potential.
Usually, an increase in holding from promoters or institutional investors (both FII and DII) signifies the growth potential these whales see in the stock, and sooner or later other market participants resonate with these decisions leading to further interest in such stocks.
What makes this incident more attractive is the fact that the increase in quantity is not a mere percent or two but a major 4.23% increase which now stands at 15.64%.
There is more!
Not only foreign promoter but DII or the Domestic Institutional Investors (Mutual Funds) were also observed to have increased their holding in the stock, which now stands at 4.80% compared to last quarter’s 3.90%.
Headquartered in Mumbai, India, Mastek limited is an enterprise level tech firm specializing in digital and cloud transformation with a global presence spanning across 40 countries including UK, Europe, US, Middle East, Asia Pacific, and India.
Mastek ltd, reported a net sales growth YOY of around 22 % for the Match quarter which stood at around Rs 709.18 crore compared to the Rs 581.53 crore in the corresponding quarter of previous financial year.
EBITDA growth stood at 4% coming to Rs 125.52 crore, from Rs 120.69 crore for last year’s March quarter while the cash flow remains healthy with a net change of Rs 125 crore.
Annual net sales now at Rs 2563.39 crore saw a 17.38% increase from last years 2183.84 crore. Consolidated net profit remained around same at Rs 293.01 crore compared to last year’s Rs 295.13 crore, an issue almost every major tech firm faced this time.
What the charts say about Mastek!
Mastek had been under consolidation since last April which finally ended by the breakout of MA 200 in the second week of May. Since then, within a week the stock has increased in value by 13.16%, accompanied by heavy volume both in traded and delivery quantity.
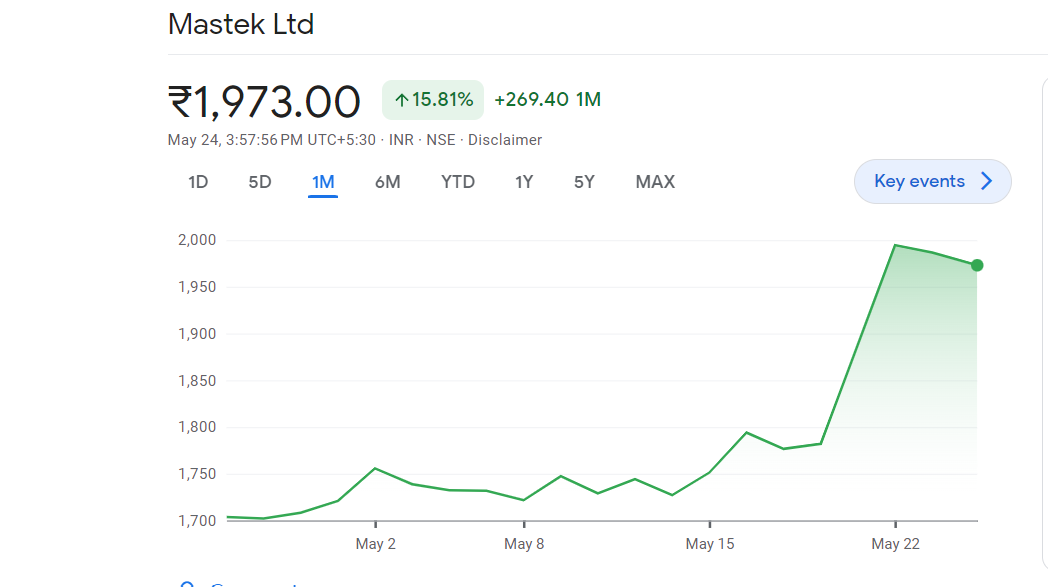
An increased delivered quantity with increase in price is considered to be a good sign, signifying investor interest and future growth opportunities.
Trading well above the 50 and 200 MA, a lower than industry PE and increased investor interest with increasing price and volume. All these factors combined definitely have a part to play in the stock’s sudden breakout from the sharp one-year consolidation and the continuing uptrend.
Mastek currently has all the indicators needed to spark a buying interest from a smart investor. It certainly holds much potential and we at Tradealone will be closely monitoring it. So stay tuned and keep reading for more opportunities and profits.
Happy Investing!


MTAR Technologies, a key player in precision engineering, recently disclosed its financial performance for the third quarter of FY2023, and the figures have certainly shocked the market. The company reported a significant downturn across the board, with a net profit plunge of 66.9% at Rs 10.4 crore compared to Rs 31.7 crore year-over-year (YoY), revenue dropping 26.1% to Rs 118.4 crore from Rs 160.2 crore (YoY), EBITDA falling 47.2% to Rs 23.8 crore from Rs 45.1 crore (YoY), and a margin reduction to 20.1% from 28.2% (YoY). Let’s delve deeper into these results, understand their implications, and consider the course of action for investors. Definitely, these are bad numbers and will surely impact the stock price movement tomorrow.
Unpacking MTAR Tech’s Q3 Performance
The sharp decline in MTAR’s topline to ₹118 crores from ₹167 crores in the previous quarter highlights a significant contraction in its revenue stream. Despite a decrease in material costs – from 54.4% to 48.1% – indicating improved margins, the bottom line suffered due to the fixed costs such as salaries, administration, depreciation, and finance costs outpacing the lower turnover. However, it’s noteworthy that the 9-month turnover has actually seen a 16% increase over the comparable period from the previous year.
Analyzing the Response and Future Outlook for Mtar
Investors and market watchers are keenly awaiting management’s explanation for the revenue dip and further details on order wins. It’s crucial to remember that for companies like MTAR, revenue flow can be uneven, leading to fluctuations in quarterly earnings. As a company with a 50-year legacy, MTAR’s current predicament could be a temporary setback or indicative of a deeper issue requiring strategic realignment.
Market Reaction and Investor Sentiment
During the last 3 months, MTAR’s stock experienced a downturn, dropping from Rs 2800 to Rs 1900. This decline was compounded by some level of shareholding dilution by the promoters, raising concerns about the company’s near-term prospects. Despite this, some market observers suggest that the current share price has already accounted for the disappointing results, anticipating a potential recovery. Now, we dont know how long will it take for the recovery. However, we believe that eventually MTAR will regain the all time high levels.

Guidance for Investors
In light of MTAR’s Q3 results, investors find themselves at a crossroads. Here’s a strategic approach to consider:
Stay Informed
Before making any decisions, it’s vital to understand the company’s direction and management’s strategy to address current challenges. Keep an eye out for official communications and market analyses that may shed light on MTAR’s path forward.
Long-term Perspective
For those invested in MTAR or considering it, it’s essential to evaluate the company’s fundamentals and growth prospects in the long run. Temporary setbacks can provide buying opportunities for those with a robust investment thesis and a long-term horizon.
Diversify
Diversification remains a cornerstone of risk management. Investors worried about MTAR’s performance should ensure their portfolio isn’t overly concentrated in a single stock or sector, mitigating potential losses.
Seek Professional Advice
Given the complex nature of investing in companies facing downturns, consulting with a financial advisor can provide personalized insights based on your investment goals and risk tolerance.
Mtar Tech Fundamental Analysis report below –
Conclusion
MTAR Technologies’ Q3 FY2023 results have undeniably raised eyebrows and prompted a reevaluation among its investor base. While the immediate reaction might lean towards pessimism, it’s crucial for investors to adopt a balanced view, considering both the company’s longstanding reputation and the inherent volatility of the market. As always, informed decision-making and strategic planning will be key to navigating this period of uncertainty.

A Landmark Achievement in Revenue and Profit Growth
New Delhi, India, January 16, 2024 – MapmyIndia, a leader in advanced digital maps and deep-tech products and platforms, has reported a milestone achievement in its financial performance for Q3FY24. The company’s total income surpassed Rs 100 Cr, indicating a robust growth trajectory in the Indian tech industry.
Financial Highlights of Q3FY24
A quick recap of quarterly results for MapmyIndia –
- Revenue Growth: MapmyIndia’s revenue reached an all-time high of Rs 92 Cr in Q3FY24, a significant 36% year-on-year (YoY) increase. The nine-month fiscal year (9MFY24) revenue now stands at ₹272.5 Cr.
- EBITDA Performance: EBITDA for Q3 grew by an impressive 38% YoY to ₹38.6 Cr. The 9MFY24 EBITDA increased by 32% YoY, totaling Rs 116.6 Cr, with an EBITDA margin of 43%.
- Profit After Tax (PAT): The PAT for 9MFY24 showed a 21% YoY growth, reaching ₹96.2 Cr. The PAT margin stands strong at 32%.
Strategic Wins and Operational Highlights
MapmyIndia secured a total of six major deals, each exceeding USD 10 million in total contract value (TCV), including a USD 40 million and a USD 20 million deal. The quarter also saw two significant empanelment agreements.
Advancing Technology and Market Leadership
Rakesh Verma, Chairman & Managing Director of MapmyIndia, expressed his enthusiasm about the company’s financial milestones and the consistent all-time high revenue. He emphasized the company’s strong EBITDA performance and robust PAT, reflecting MapmyIndia’s growing influence in the digital transformation space.
Rohan Verma, CEO & Executive Director, highlighted the broad-based revenue growth across various sectors and products. He noted significant achievements in auto OEM NCASE suites, consumer tech companies, enterprises, and government contracts.
About MapmyIndia & Mappls (C.E. Info Systems Ltd)
MapmyIndia, also known globally as Mappls, is India’s premier digital mapping and deep-tech company. It offers MaaS, SaaS, and PaaS, with advanced digital map data, software products, platforms, APIs, IoT, and solutions to a diverse clientele. The company has served over 2000 enterprise customers and is a pioneer in digital mapping in India, continuously evolving its AI-powered Digital Metaverse Twin of the Real World.
Impact on stock market
Trading at a very high premium of 90, MapMyIndia is not a cheap stock to purchase. Each share is trading at 2039 rupees as of today, when the market closed. Kindly consult your advisor before making any decision to purchase this stock. Its a growth company, meant for aggressive investors only.
Looking Ahead to Q4FY24
With a strong order book and anticipation of new developments, MapmyIndia is poised for an exciting Q4FY24. The company’s 360-degree marketing strategy for its consumer business has been effective, leading to increased brand awareness and product traction.

Robust Financial Performance Marks the Quarter
Mumbai, January 16, 2024 – L&T Technology Services Limited, a frontrunner in pure-play engineering services in India, has reported a significant double-digit growth in both revenue and profit for the third quarter ended December 31, 2023.
Financial Highlights of Q3FY24
- Revenue Surge: The company’s revenue stood at Rs 2,422 crore, marking a 12% year-on-year (YoY) and 2% quarter-on-quarter (QoQ) growth.
- USD Revenue Growth: USD Revenue reached $290.7 million, with an 11% YoY and 1% QoQ increase.
- Net Profit: A notable 13% YoY growth in net profit, totaling Rs 336 crore.
- EBIT Margin: The EBIT margin was reported at a healthy 17.2%.
Major Deals and Strategic Wins
The quarter witnessed L&T Technology Services securing six significant deals, each over USD 10 million in total contract value (TCV). This includes one mega-deal worth USD 40 million and another substantial deal of USD 20 million, spanning various industry segments. Additionally, the company signed two major empanelment agreements.
Advancements in New-Technology Focus Areas
Amit Chadha, CEO & Managing Director of L&T Technology Services, highlighted the company’s progress in AI, software-defined vehicles (SDV), and cybersecurity. Key achievements include:
- AI Patents: Filing 53 patents across Transportation, Medical, and Industrial Products segments.
- SDV Win: Securing a significant deal with a US OEM for next-generation automobile architecture.
- Cybersecurity Deal: A notable USD 10M+ deal win in cybersecurity.
Operational Highlights and Recognitions
- Consistent Segment Growth: Positive growth across all five segments, achieving 1% sequential growth despite seasonal softness.
- Digital Transformation Partnership: Beginning a significant relationship with bp for driving digital transformation.
- Zinnov Ratings: LTTS rated as leaders in 14 engineering domains, including Digital Engineering Services and Industry 4.0.
- Workplace Recognition: Named Most Preferred Workspace 2023 – 24 in the IT/ITES category by Marksmen Daily.
Digital Engineering Awards and Women-in-Tech Boost
The Digital Engineering Awards co-hosted by L&T Technology Services saw a record number of nominations, with women engineers’ participation doubling year-on-year.
Patent Portfolio and Human Resources
As of Q3FY24, LTTS’s patent portfolio stands at 1,249, with a significant number co-authored with customers. The employee strength was reported at 23,298. It would be interesting to see how market reacts to the quarterly results for LTTS. Investors can expect a gap up opening for sure.
About L&T Technology Services Ltd
L&T Technology Services Limited, a subsidiary of Larsen & Toubro Limited, specializes in Engineering and R&D (ER&D) services. Catering to a wide range of industries, LTTS is known for its consultancy, design, development, and testing services. With a global presence and a significant talent pool, LTTS is at the forefront of innovation and cutting-edge technology solutions.
-
 Profit Making Idea1 year ago
The Grandfather Son (GFS) Strategy: A Technical Analysis Trading Strategy
-

 Uncategorized8 months ago
A BJP victory and the Stock Market: what to expect this monday
-

 Technology5 months ago
Innovative Metro Ticketing Revolution in Pune by Route Mobile and Billeasy’s RCS Messaging. Stock trades flat
-
 editor9 months ago
How to research for Multibagger Stocks
-
 Trending12 months ago
Does the “Tata-Apple venture” benefit Tata shares?
-
 Finance World12 months ago
How Zomato Turned Profitable: A Landmark Achievement in the Indian Food Delivery Market
-
 Market ABC8 months ago
Spotting an operator game: How to do it?
-
 Market ABC1 year ago
The Pullback Strategy: A Timeless Approach to Investment Success